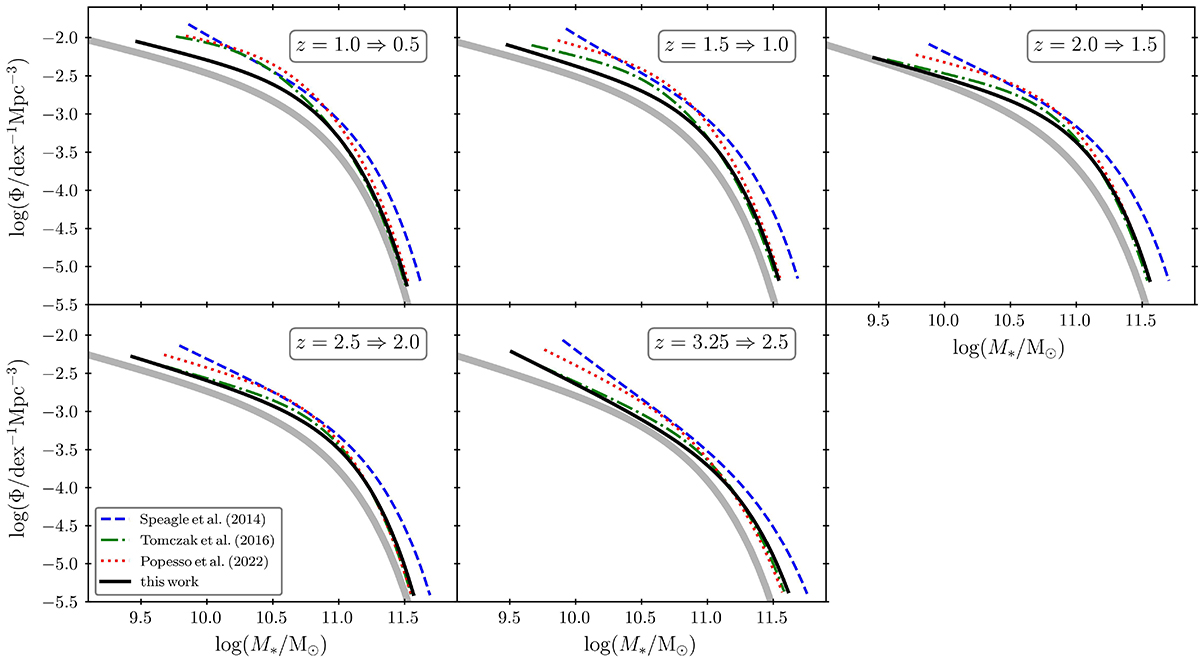
Fig. 8.
Download original image
Comparison between the observed and simulated star-forming GSMFs. The simulated GSMFs are constructed by “growing” the observed function of McLeod et al. (2021), between the redshifts listed in the upper right corner of each panel, according to Eq. (11). The mass evolution resulting from assumed star-forming MSs of Speagle et al. (2014), Tomczak et al. (2016) and Popesso et al. (2023), are plotted with dashed blue, dash-dotted green, and dotted red lines, respectively. The simulated function constructed using the results of this work are presented in solid black, while the thick solid gray line represents the observed GSMF at the final redshift of each simulation. The inconsistencies at low- and high-mass ends of the simulated GSMFs come from differences in the corresponding shapes of the MSs involved (Fig. 7). The significant shift in densities between the observed and simulated GSMFs is caused by the fraction of SFGs, simulated between the redshifts in question, entering a quiescent mode, as is discussed in Sect. 5.4.
Current usage metrics show cumulative count of Article Views (full-text article views including HTML views, PDF and ePub downloads, according to the available data) and Abstracts Views on Vision4Press platform.
Data correspond to usage on the plateform after 2015. The current usage metrics is available 48-96 hours after online publication and is updated daily on week days.
Initial download of the metrics may take a while.