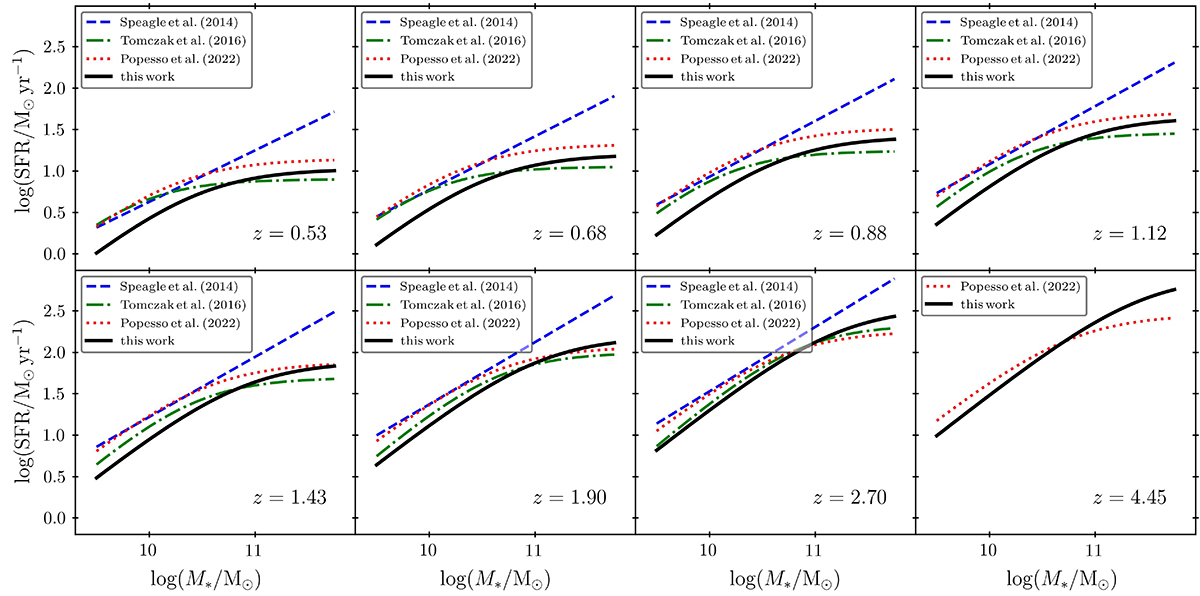
Fig. 7.
Download original image
Best-fit star-forming MS shown at each redshift bin studied in this work as the solid black line. For comparison, we show the relations of Speagle et al. (2014), Tomczak et al. (2016) and Popesso et al. (2023), plotted with dashed blue, dash-dotted green, and dotted red lines, respectively. While all the functions tend to roughly agree with each other, some inconsistencies can clearly be seen, discussion of which is presented in Sect. 5.3.
Current usage metrics show cumulative count of Article Views (full-text article views including HTML views, PDF and ePub downloads, according to the available data) and Abstracts Views on Vision4Press platform.
Data correspond to usage on the plateform after 2015. The current usage metrics is available 48-96 hours after online publication and is updated daily on week days.
Initial download of the metrics may take a while.