Fig. 6.
Download original image
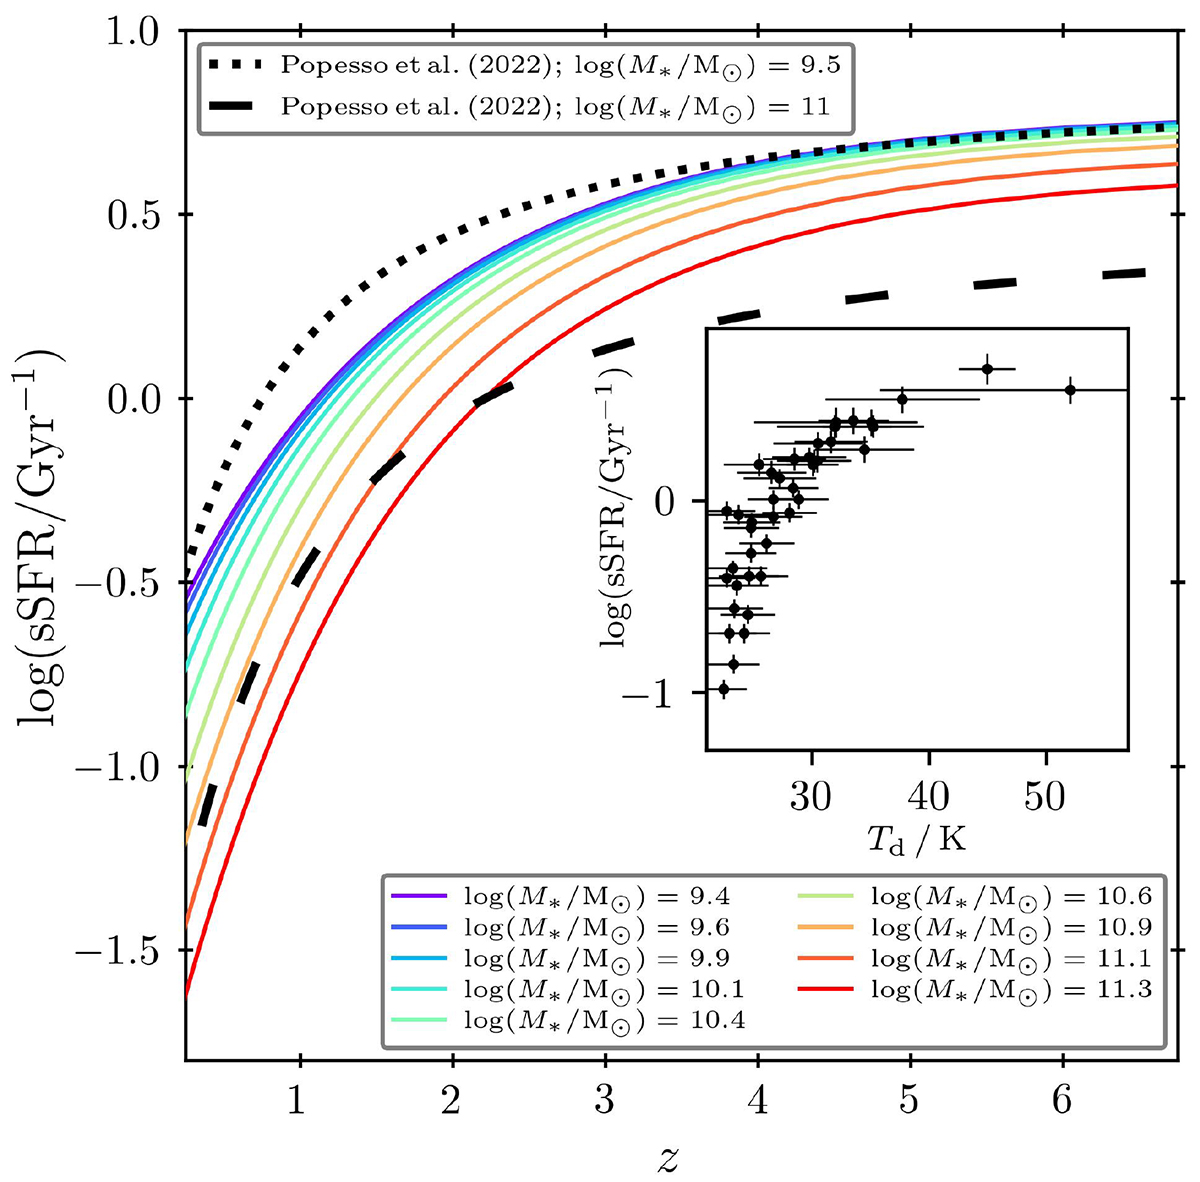
Logarithm of the sSFR, derived from the best-fit functional forms of the star-forming MS found in this work, plotted as a function of redshift and color-coded with stellar mass. The shape of the relations is consistent with the redshift evolution of the molecular gas fraction in SFGs, as is discussed in Sect. 5.3. For comparison, we show the findings of Popesso et al. (2023) at two stellar mass regimes. The inset plot shown the relation between the sSFR and peak dust temperature. The similar shapes of the sSFR evolution with z and Td is consistent with the scenario, presented in Liang et al. (2019), in which different dust temperature are mainly driven by the variations in the sSFR (see Sect. 5.2).
Current usage metrics show cumulative count of Article Views (full-text article views including HTML views, PDF and ePub downloads, according to the available data) and Abstracts Views on Vision4Press platform.
Data correspond to usage on the plateform after 2015. The current usage metrics is available 48-96 hours after online publication and is updated daily on week days.
Initial download of the metrics may take a while.