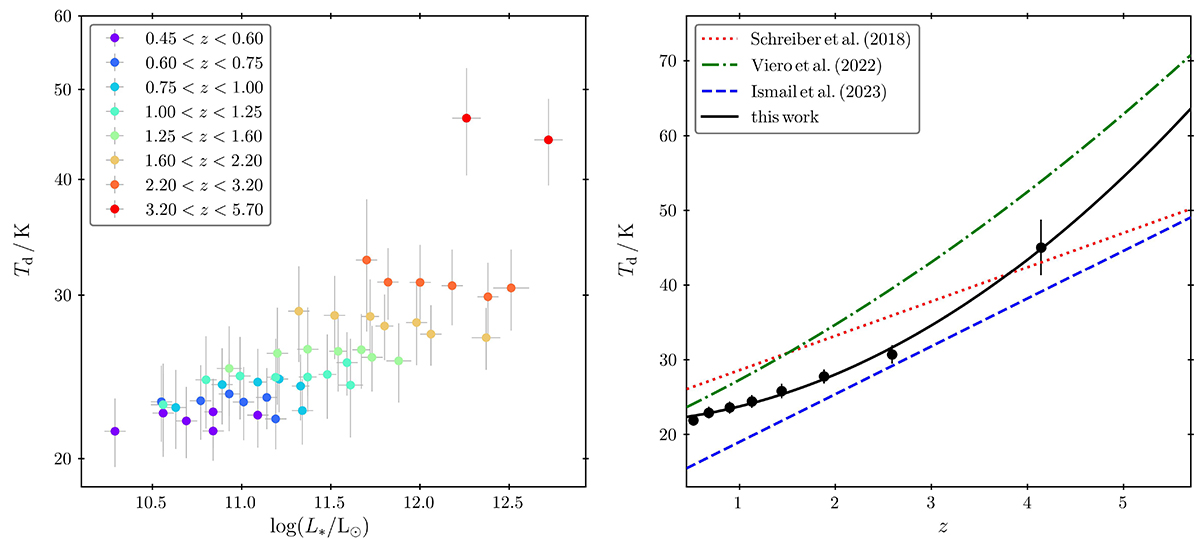
Fig. 5.
Download original image
Evolution of peak dust temperature found in this work. Left panel: The peak dust temperatures, Td, as a function of the IR luminosity, LIR, color-coded with redshift. It can be seen that while Td increases with LIR between z = 0.45 − 5.7, it does not seem to significantly vary at any given redshift. Right panel: Since Td variations with LIR at any given redshift remain small, we plot the average peak dust temperature as a function of redshift as black points, with the best-fit solid black line. For comparison, we show the relations of Schreiber et al. (2018), Viero et al. (2022) and Ismail et al. (2023) as dotted red, dash-dotted green, and dashed blue lines, respectively. For discussion see Sect. 5.2.
Current usage metrics show cumulative count of Article Views (full-text article views including HTML views, PDF and ePub downloads, according to the available data) and Abstracts Views on Vision4Press platform.
Data correspond to usage on the plateform after 2015. The current usage metrics is available 48-96 hours after online publication and is updated daily on week days.
Initial download of the metrics may take a while.