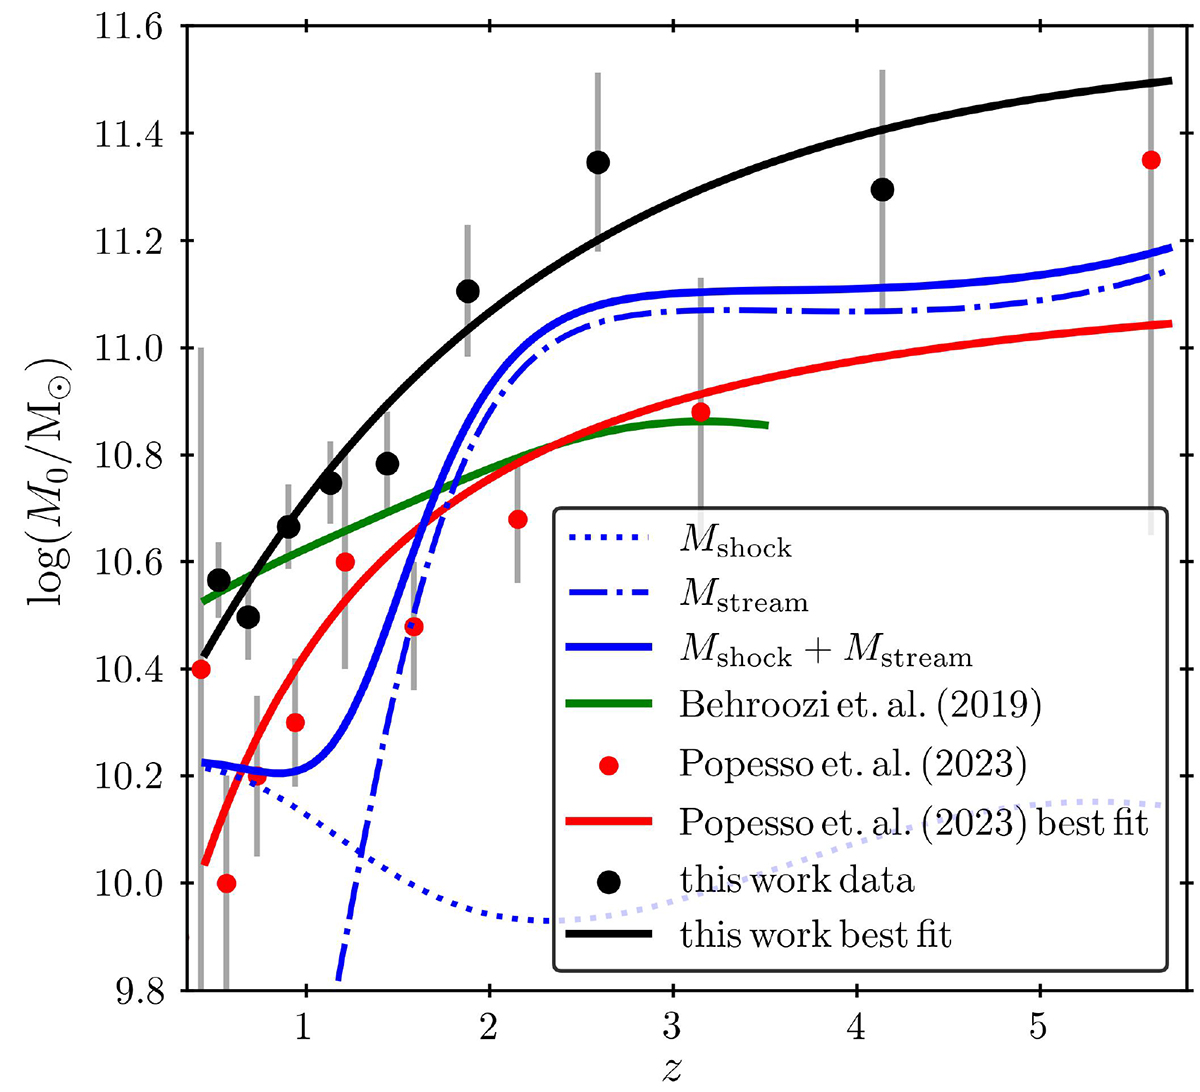
Fig. 4.
Download original image
Mshock and Mstream boundaries, above which the star formation is theoretically expected to be quenched, as is described in Sect. 5.1, shown in blue, where halo masses were converted to stellar masses using the prescription of Behroozi et al. (2013). The empirical curve of Behroozi et al. (2013) is also shown with a solid green line. For comparison, the results of this work are plotted in black. Red data represents the M0 redshift evolution found in Popesso et al. (2023).
Current usage metrics show cumulative count of Article Views (full-text article views including HTML views, PDF and ePub downloads, according to the available data) and Abstracts Views on Vision4Press platform.
Data correspond to usage on the plateform after 2015. The current usage metrics is available 48-96 hours after online publication and is updated daily on week days.
Initial download of the metrics may take a while.