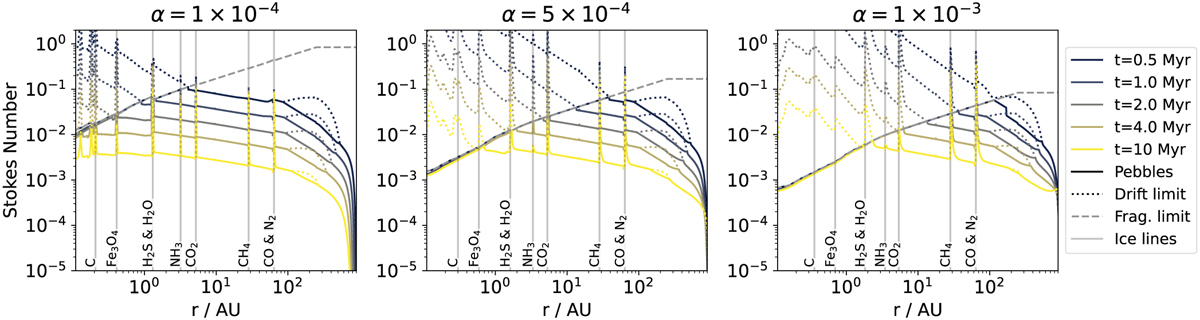
Fig. A.1
Download original image
Stokes Number of pebbles (solid lines), the drift limit (dotted lines) and fragmentation limit (grey dashed line) at different times (colours) for the unperturbed disc. The different viscosities are shown from left to right (setups: V1noP, V5noP & V10noP). Vertical lines show the position of various ice lines. The fragmentation limit is only shown for t = 0.5 Myr because it is almost constant over time.
Current usage metrics show cumulative count of Article Views (full-text article views including HTML views, PDF and ePub downloads, according to the available data) and Abstracts Views on Vision4Press platform.
Data correspond to usage on the plateform after 2015. The current usage metrics is available 48-96 hours after online publication and is updated daily on week days.
Initial download of the metrics may take a while.