Fig. 3
Download original image
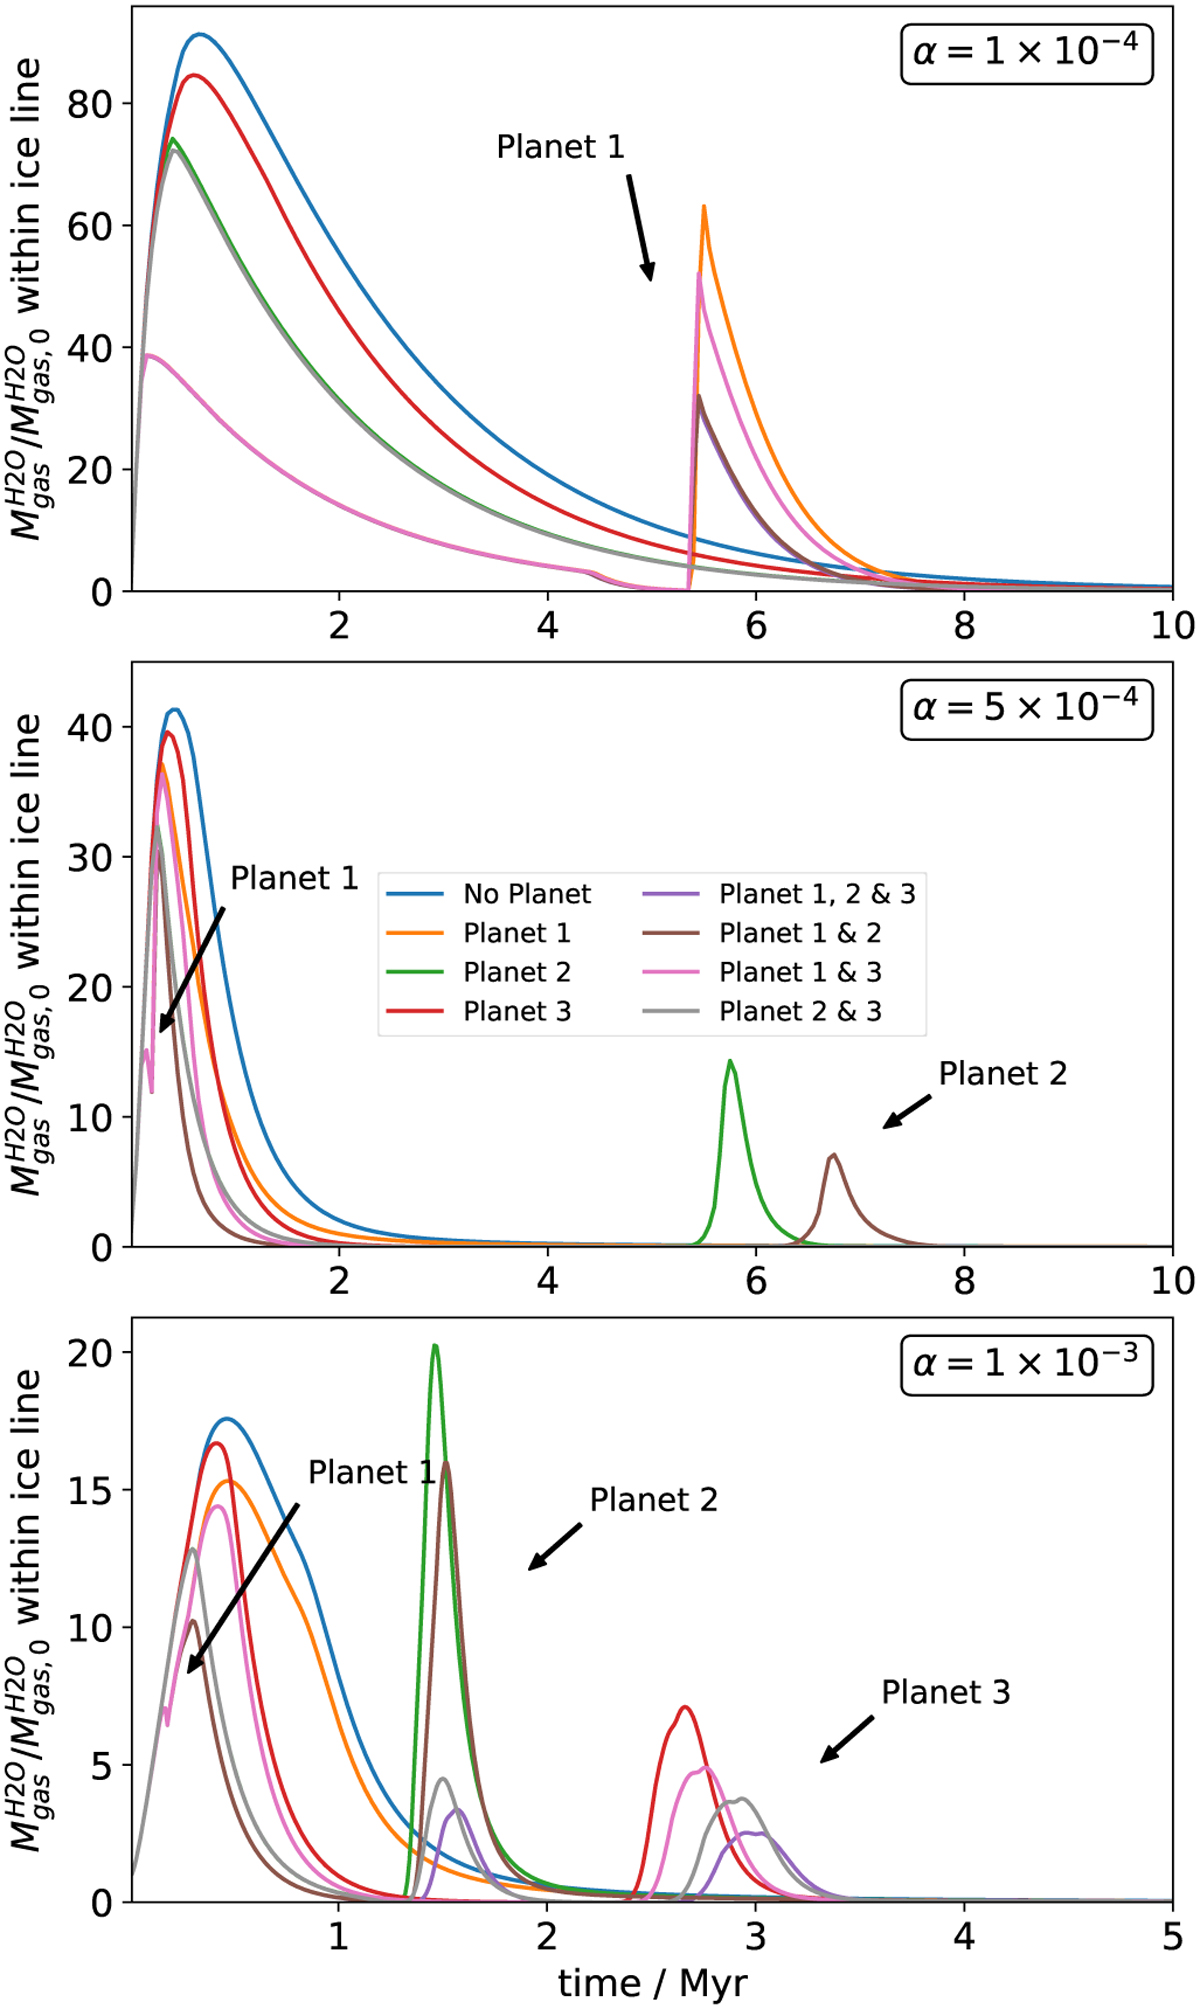
Water mass fraction within the ice line (i.e. integrated over the region with a radius smaller or equal to the position of the water ice line) normalised by the initial value against time. The panels from top to bottom show the three disc viscosities. We note that for α = 1 × 10⁻³ the x-axis only spans to t = 5 Myr, but the late evolution does not deviate from zero which can also be seen in Fig. 2. The colours correspond to different simulation cases, and arrows indicate which planet causes the water vapour to increase by crossing the water ice line.
Current usage metrics show cumulative count of Article Views (full-text article views including HTML views, PDF and ePub downloads, according to the available data) and Abstracts Views on Vision4Press platform.
Data correspond to usage on the plateform after 2015. The current usage metrics is available 48-96 hours after online publication and is updated daily on week days.
Initial download of the metrics may take a while.