Fig. 8
Download original image
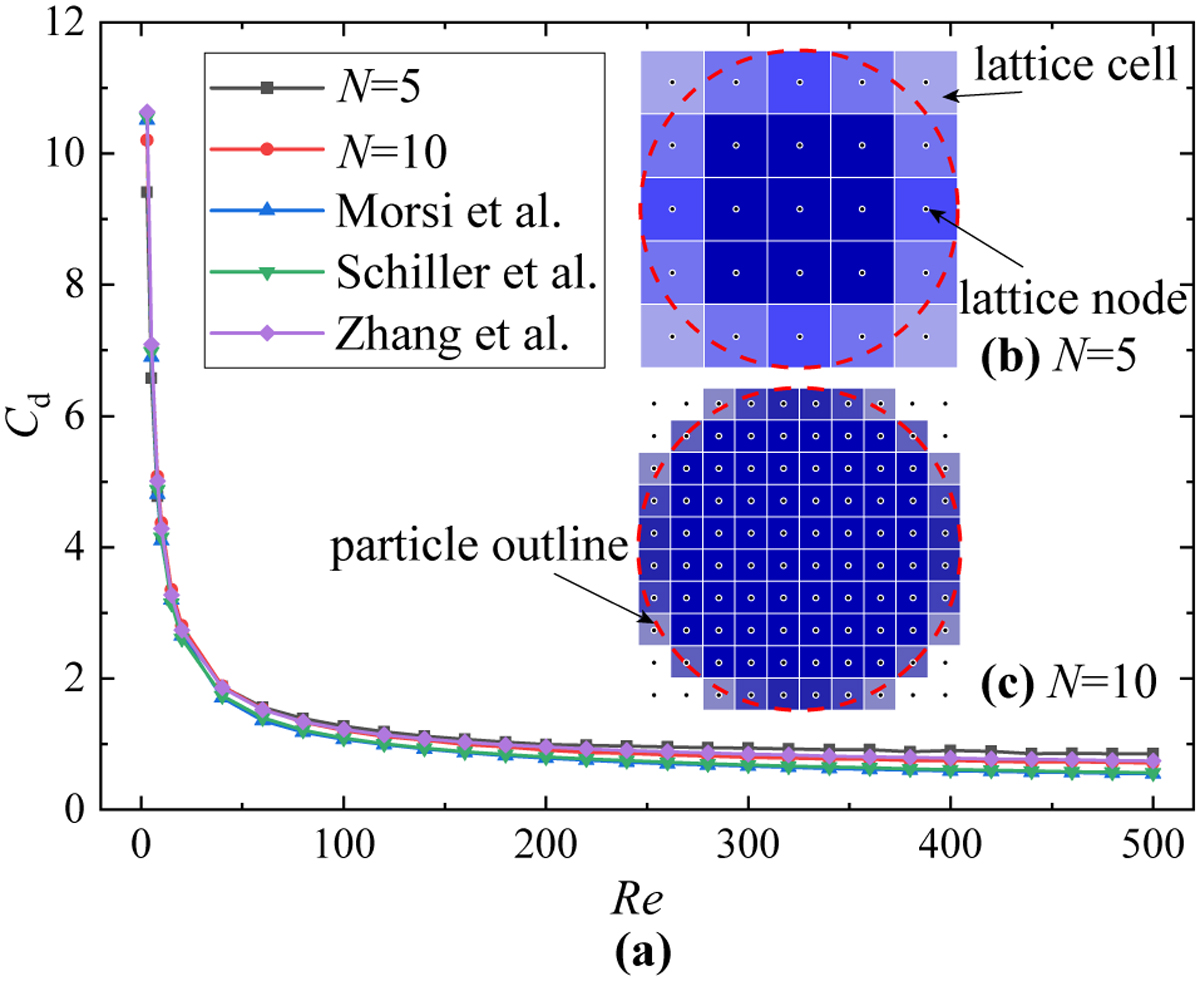
Validation simulation results in the context of 3D conditions. (a) Comparison of the streamwise drag coefficient versus the Reynolds number in this work and in Schiller & Naumann (1935), Morsi & Alexander (1972), and Zhang & VanderHeyden (2002). (b and c) 2D representations depicting a DEM sphere mapped onto the LBM lattice grid at a lattice resolution of N = 5 and N = 10, respectively.
Current usage metrics show cumulative count of Article Views (full-text article views including HTML views, PDF and ePub downloads, according to the available data) and Abstracts Views on Vision4Press platform.
Data correspond to usage on the plateform after 2015. The current usage metrics is available 48-96 hours after online publication and is updated daily on week days.
Initial download of the metrics may take a while.