Fig. 8.
Download original image
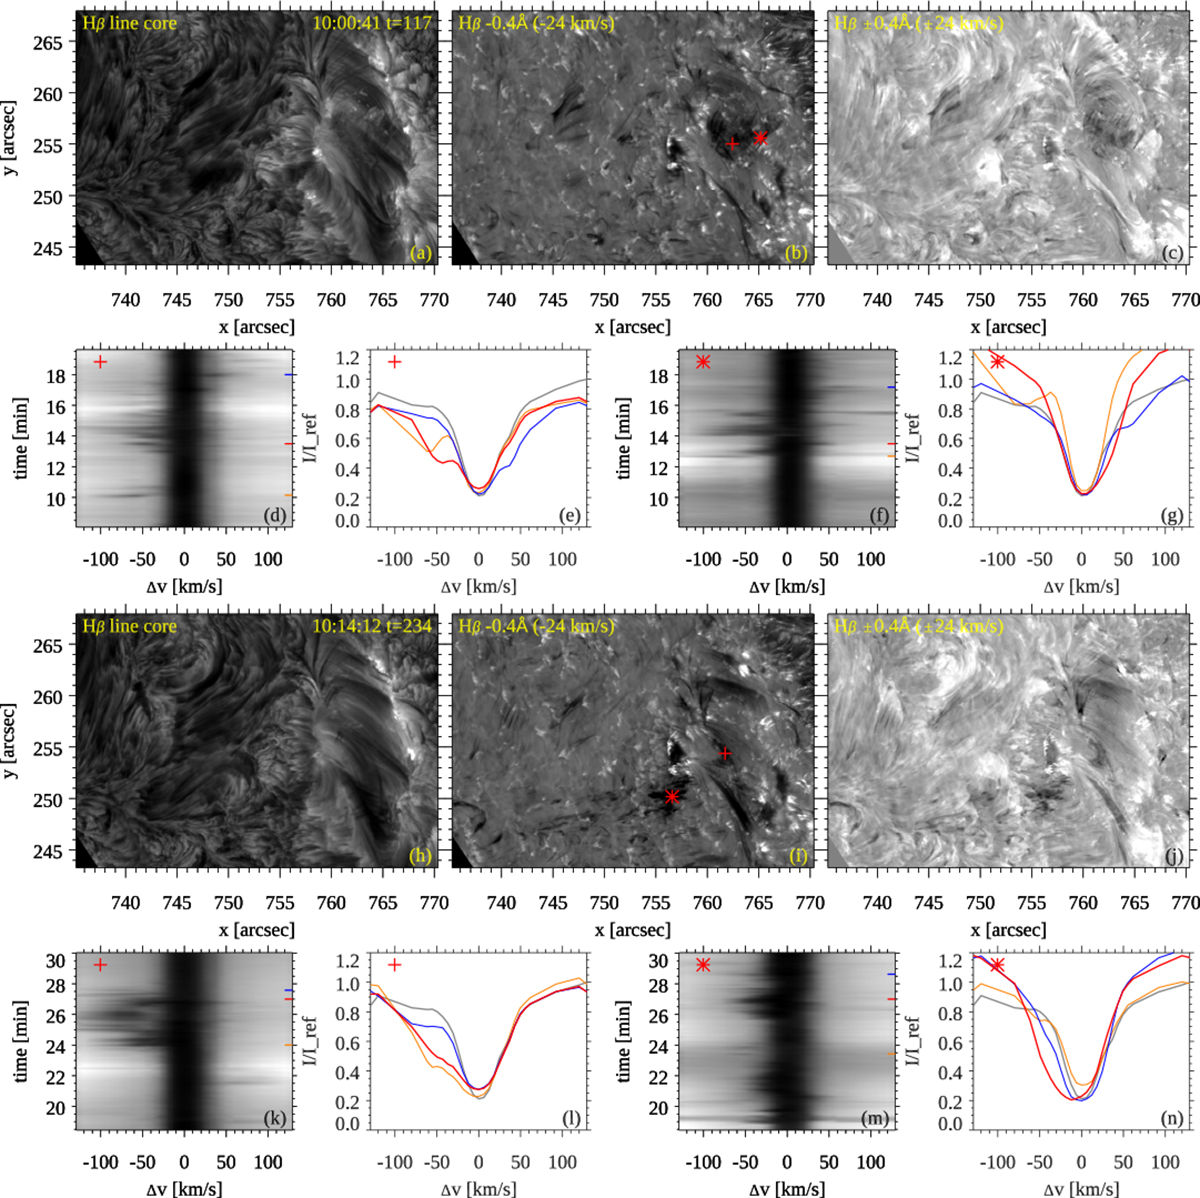
CHROMIS Hβ observations of the swirling flux rope (panels a–g) and Jet 2 (panels h–n). For two time steps (10:00 UT and 10:14 UT), the row of images (a–c, and h–j) shows the Hβ line core, the blue wing, and a Dopplergram, respectively. In the Hβ wing images, a red plus symbol and an asterisk mark the locations for which the spectral evolution in λt diagrams is shown in panels (d), (f), (k), and (m). The spectral profiles for these locations for the two chosen time steps are shown in red in the profile panels (e), (g), (l), and (n). For each λt diagram, two more spectral profiles from different times are shown in orange and blue. The times for these profiles are indicated with short colored dashes in the λt diagrams. The thin gray profile is a reference Hβ profile, which is the average over a quiet region. The time along the t axis in the λt diagrams is in minutes after the start of the observation at 09:47:08 UT. An animation of the three image panels is provided in the online material.
Current usage metrics show cumulative count of Article Views (full-text article views including HTML views, PDF and ePub downloads, according to the available data) and Abstracts Views on Vision4Press platform.
Data correspond to usage on the plateform after 2015. The current usage metrics is available 48-96 hours after online publication and is updated daily on week days.
Initial download of the metrics may take a while.