Fig. 6.
Download original image
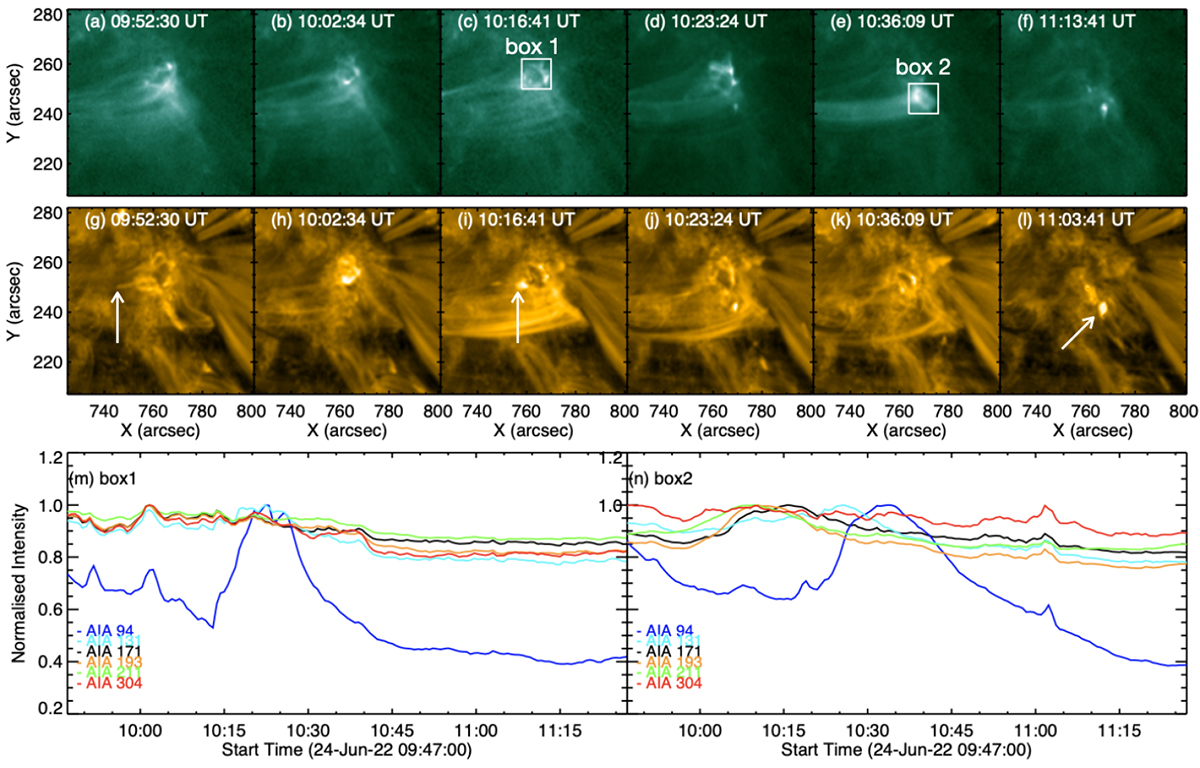
Drifting of the brightening from north (box1) to south (box2). Top row: AIA 94 Å middle row: AIA 171 Å bottom row: Temporal evolution of the normalized intensity in six AIA channels in box1 and box2. Three jets are marked with white arrows in panels (g), (i), and (l), respectively. Drifting of the hot material is quantified in the hot AIA 94 Å channel with the normalized intensity curves (blue curve in the bottom row).
Current usage metrics show cumulative count of Article Views (full-text article views including HTML views, PDF and ePub downloads, according to the available data) and Abstracts Views on Vision4Press platform.
Data correspond to usage on the plateform after 2015. The current usage metrics is available 48-96 hours after online publication and is updated daily on week days.
Initial download of the metrics may take a while.