Fig. 5.
Download original image
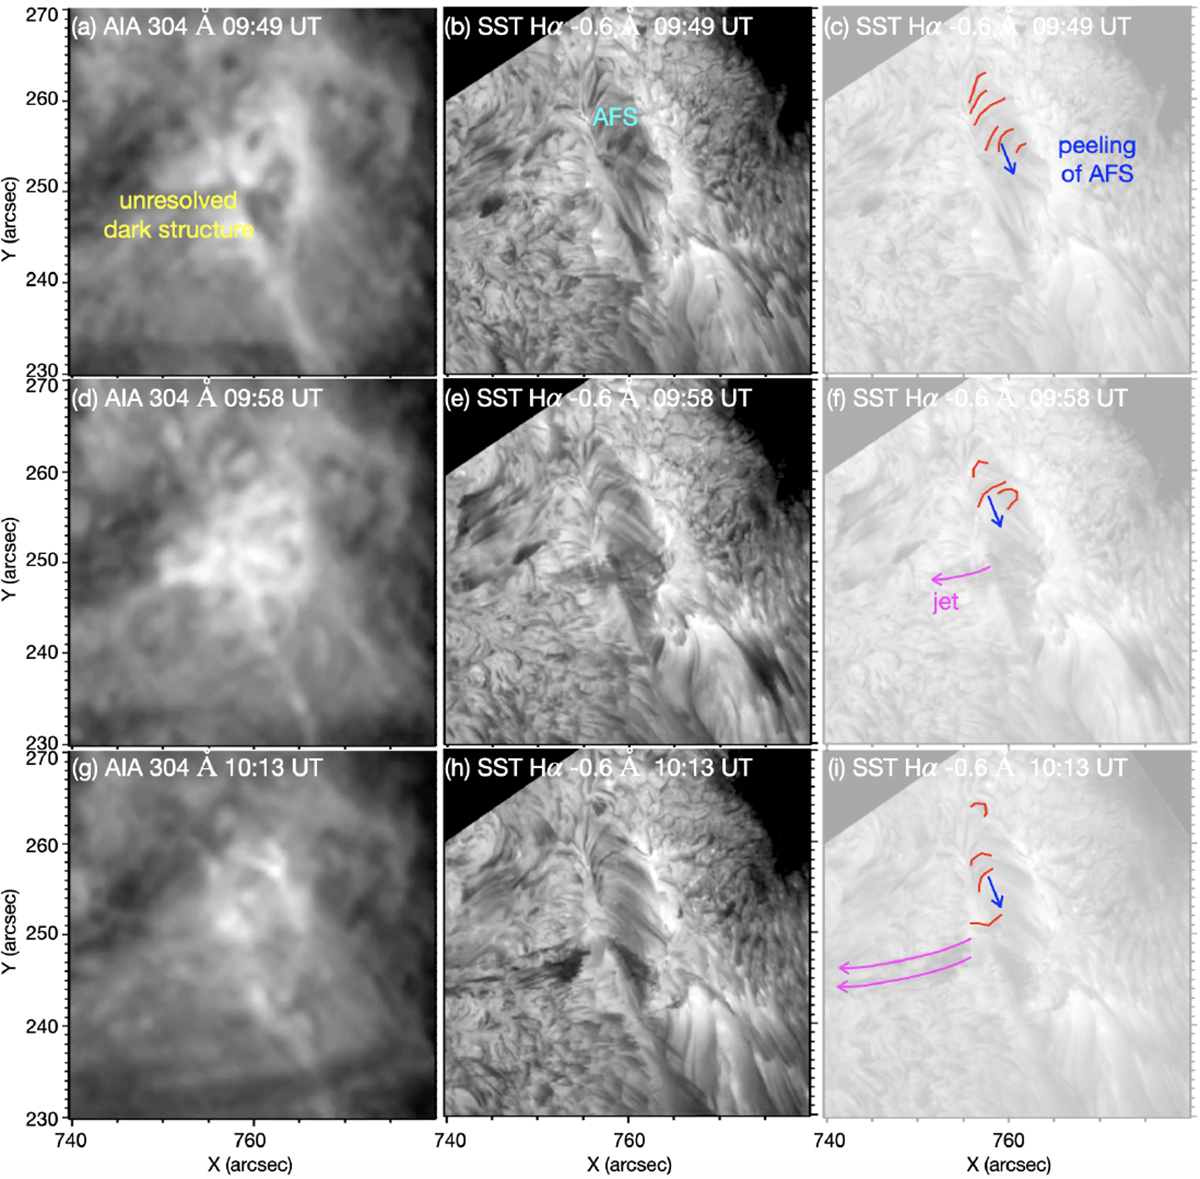
Zoom onto the AFS region, corresponding to the field of view displayed in Fig. 4 (panel b). The left column displays observations in the AIA 304 Å wavelength, the middle column shows SST observations in the Hα blue wing, and the right column is the same as the middle but in pale rendering. The right column was used to manually trace the peeled stripes (marked in red) from the AFS. The blue arrow indicates the direction of the peeling material flowing southward and contributing to the jet (highlighted in magenta color). The feature observed in AIA 304 Å appears as an unresolved dark structure, which is resolved in SST observations as an AFS. This figure is accompanied by an online animation.
Current usage metrics show cumulative count of Article Views (full-text article views including HTML views, PDF and ePub downloads, according to the available data) and Abstracts Views on Vision4Press platform.
Data correspond to usage on the plateform after 2015. The current usage metrics is available 48-96 hours after online publication and is updated daily on week days.
Initial download of the metrics may take a while.