Fig. 3.
Download original image
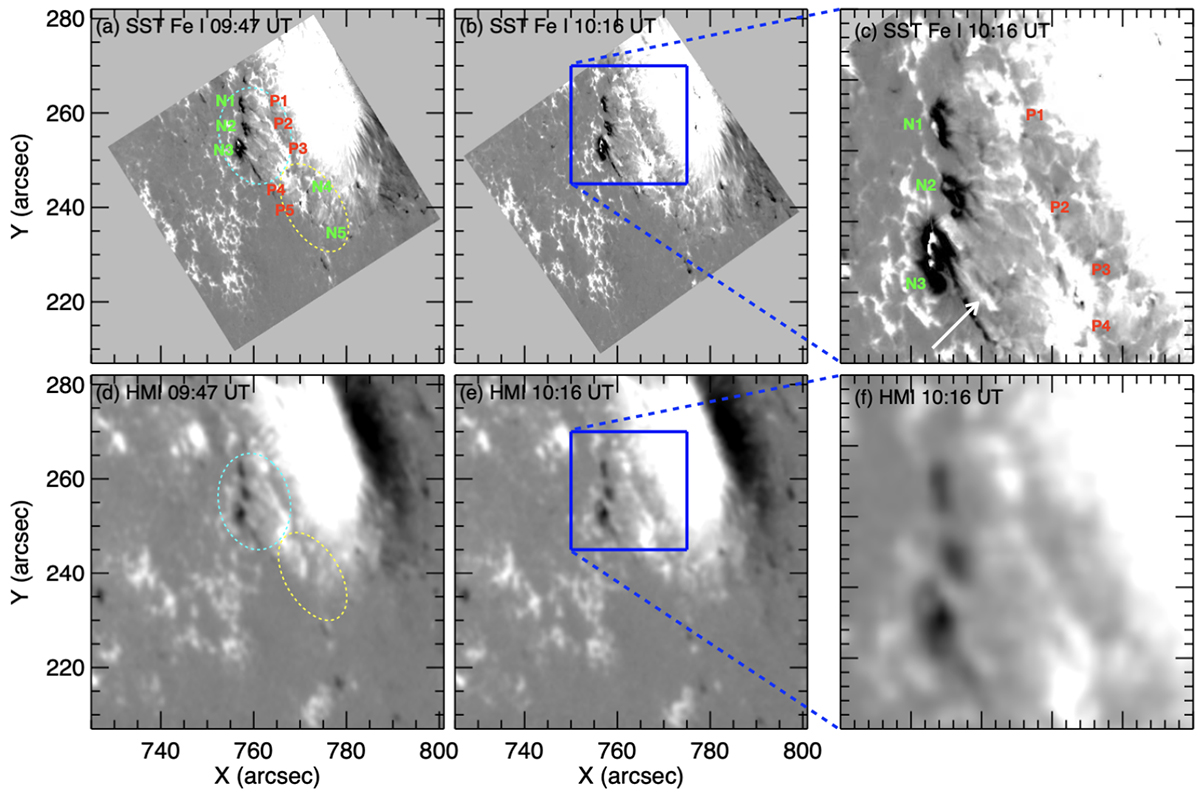
Magnetic field configuration resulting from the emerged magnetic flux. The left column is observed with CRISP and right column is observed with HMI. Two systems of negative and positive polarities can be identified: in the north, N1, N2, and N3 with P1, P2, and P3, and in the south N4 and N5 with P4 and P5. We can see the weak negative polarities N4 and N5 in the CRISP observation (panel a). These are moving continuously and the HMI spatial resolution is not sufficient to resolve them. The right column zooms onto the blue rectangular area shown in the middle row. The white arrow in panel (c) shows the magnetic polarities moving between the negative (N3) and positive (P3-P4) boundaries observed in the longitudinal magnetic field maps. An animation is attached online with this figure to show the magnetic field evolution from 09:47 to 11:30 UT. The threshold of the magnetic field is ±500 G.
Current usage metrics show cumulative count of Article Views (full-text article views including HTML views, PDF and ePub downloads, according to the available data) and Abstracts Views on Vision4Press platform.
Data correspond to usage on the plateform after 2015. The current usage metrics is available 48-96 hours after online publication and is updated daily on week days.
Initial download of the metrics may take a while.