Fig. 1.
Download original image
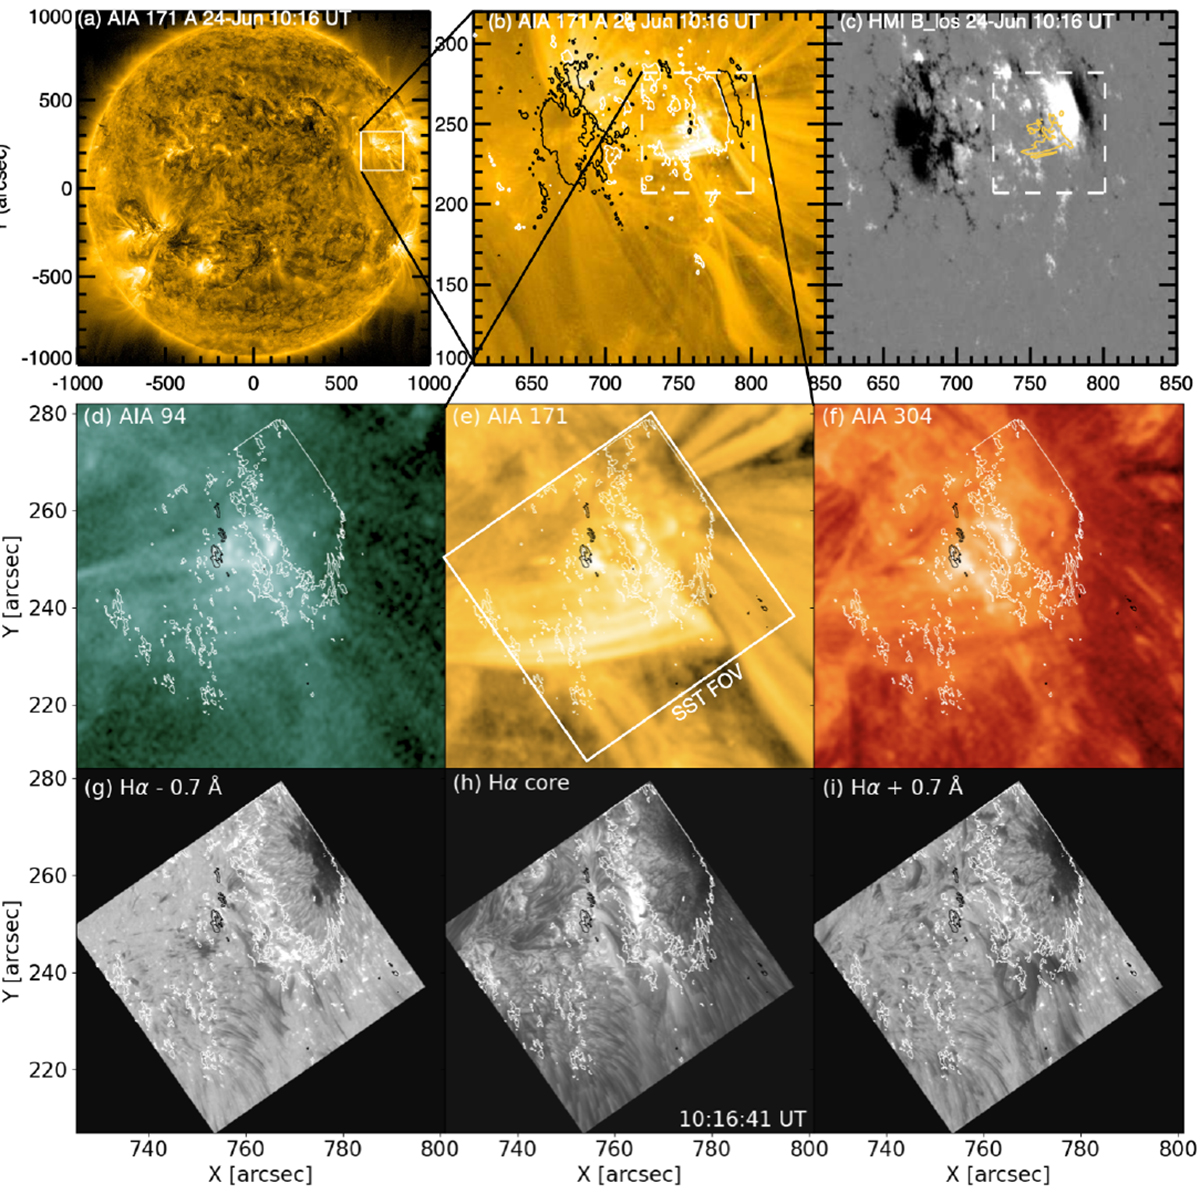
General overview of AR 13038, where the location of the AR is marked with a white rectangular box in the full disk AIA 171 Å image (panel a) and the focused FOV is shown in panels (b) and (c). The white box in panel (b–c) is the FOV for the middle and last row, showing the maximum FOV, which was covered during the coordinated observations by SST. The straight enhancement of brightening in 171 Å (yellow contours of AIA 171 in panel c) is along with the polarity inversion line between the main positive polarity and the emerged negative polarity (N1, N2, N3 in Fig. 2). The white and black contours label the magnetic field strength of ±500 G. The middle row presents the AIA observations aligned to SST observations at a specific time and the AIA spatial resolution is blown up to the SST spatial resolution. An animation is attached online with this figure to show the evolution of the jet region from 09:47 to 11:30 UT.
Current usage metrics show cumulative count of Article Views (full-text article views including HTML views, PDF and ePub downloads, according to the available data) and Abstracts Views on Vision4Press platform.
Data correspond to usage on the plateform after 2015. The current usage metrics is available 48-96 hours after online publication and is updated daily on week days.
Initial download of the metrics may take a while.