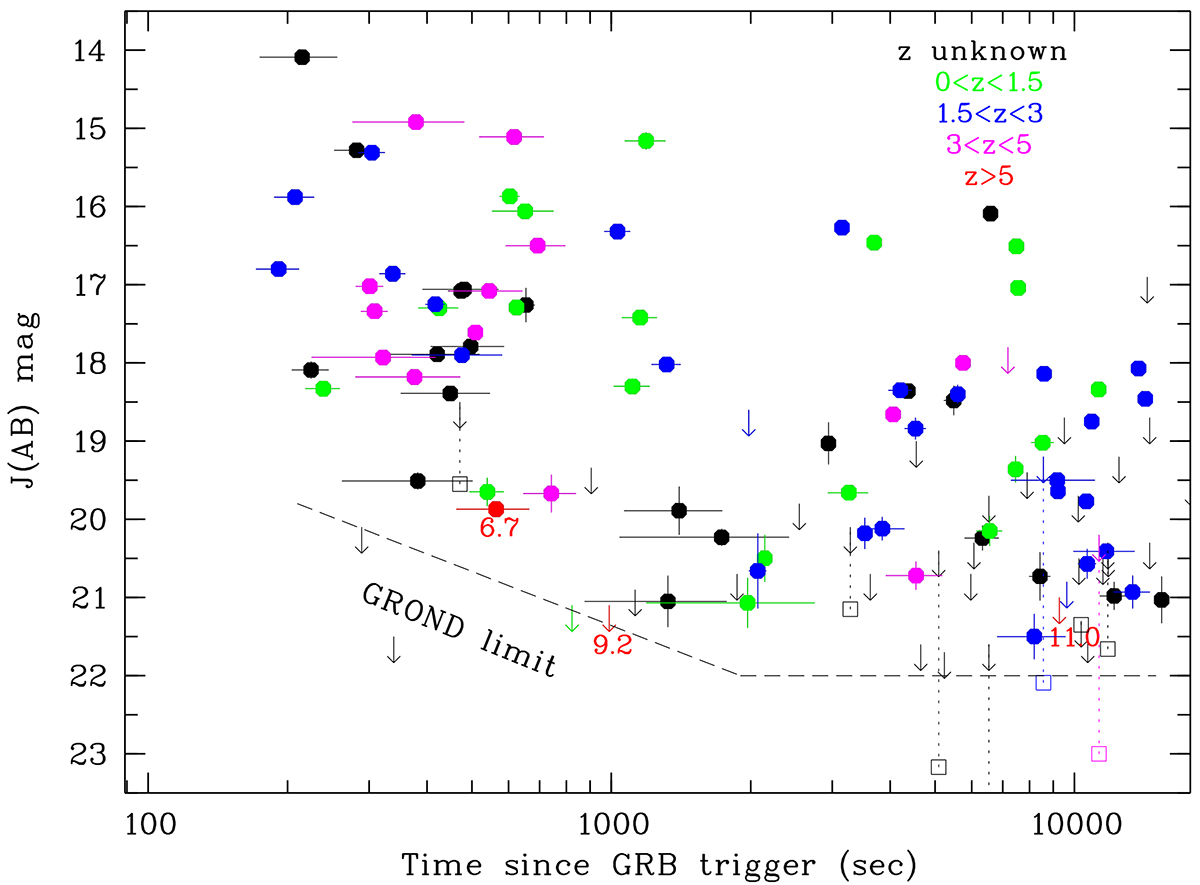
Fig. 6.
Download original image
Sample of 122 long GRB afterglows observed with GROND within the first 4 hr, coloured according to redshift. For bright afterglows, these are the first 4-min exposures; for fainter afterglows, stacking of multiple exposures has been applied (as indicated by horizontal ‘error’ bars) and a compromise between amount of stacking and time after the GRB has been adopted. The sensitivity limit of This email address is being protected from spambots. You need JavaScript enabled to view it. is given as dashed line, assuming a start of the exposure at 150 s and an exposure of 60 s, thereafter improving as time progresses: at early times, this is close to the typical t−1 afterglow fading rate. For those afterglows with J-band upper limits but z′-detections, we plotted an open square at the expected J-band value (using a mean colour of z − J = 0.15 mag), connecting it with the downwards arrow with a dotted line (GRB 120328A at 6534 s has z′ = 23.79±0.35, outside of the plot). The sky background limits our sensitivity to J(AB) ≲ 22 mag, irrespective of exposure duration.
Current usage metrics show cumulative count of Article Views (full-text article views including HTML views, PDF and ePub downloads, according to the available data) and Abstracts Views on Vision4Press platform.
Data correspond to usage on the plateform after 2015. The current usage metrics is available 48-96 hours after online publication and is updated daily on week days.
Initial download of the metrics may take a while.