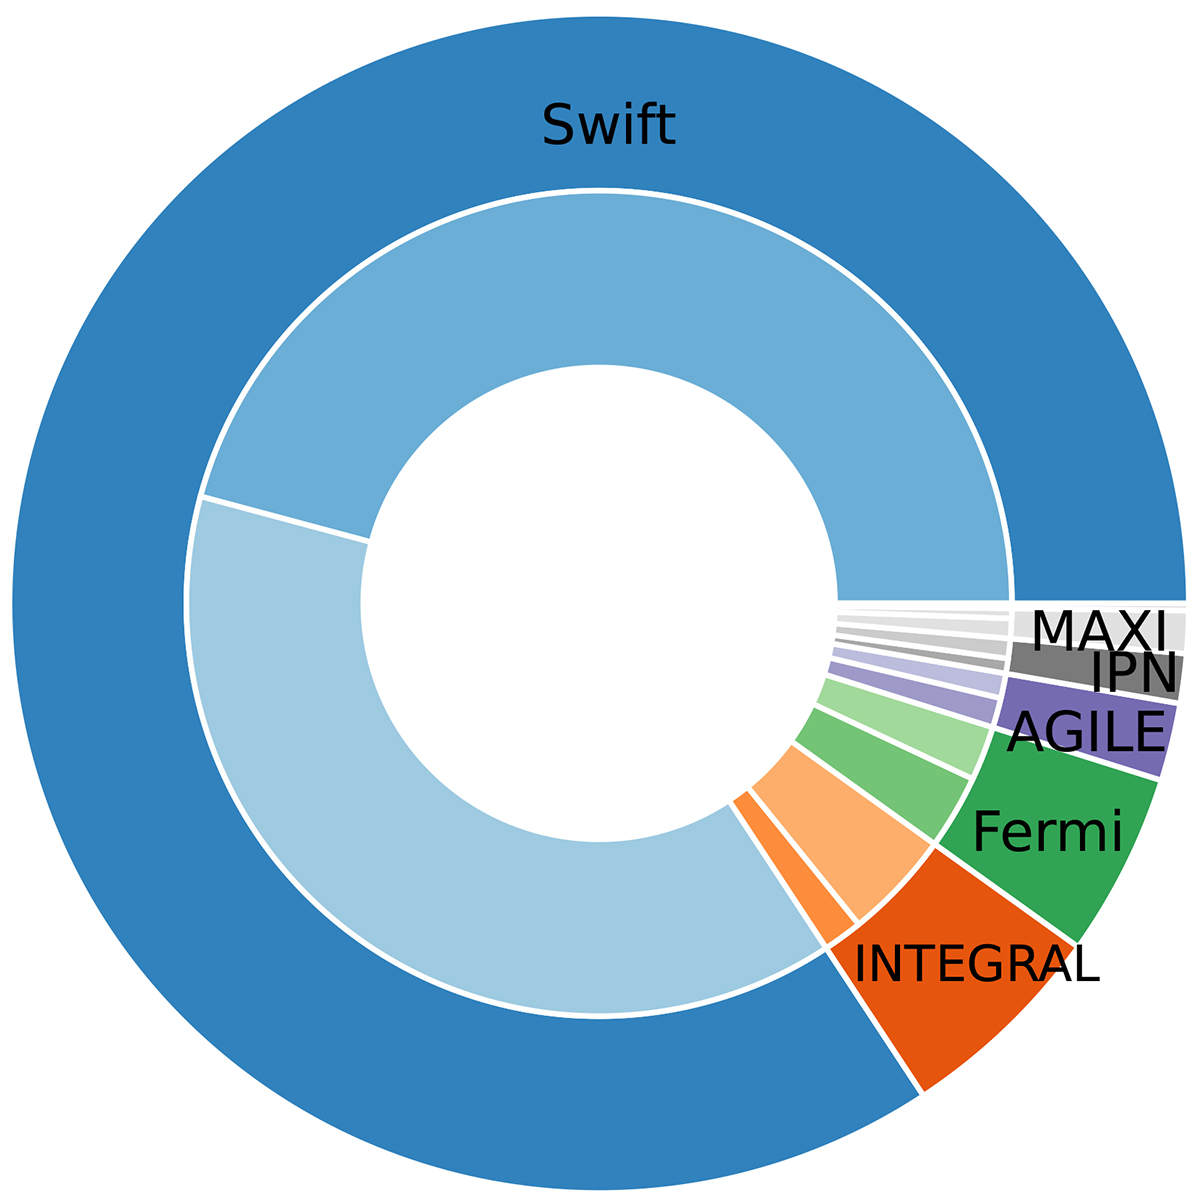
Fig. 4.
Download original image
Pie diagram of the satellite-origin of the 514 GROND-observed GRBs: the outer circle represents the overall ratio of the missions providing the trigger, the inner circle depicts the ratio of detected (darker colour) vs. non-detected (lighter colours) optical/NIR afterglows. The thin slice above MAXI is the optically identified iPTF14yb transient, which later was related to GRB 140226A based on a Mars/Odyssey, Konus-Wind and INTEGRAL data. The vast majority of GROND-observed are from Swift and thus have XRT-positions and spectra.
Current usage metrics show cumulative count of Article Views (full-text article views including HTML views, PDF and ePub downloads, according to the available data) and Abstracts Views on Vision4Press platform.
Data correspond to usage on the plateform after 2015. The current usage metrics is available 48-96 hours after online publication and is updated daily on week days.
Initial download of the metrics may take a while.