Open Access
Fig. 2.
Download original image
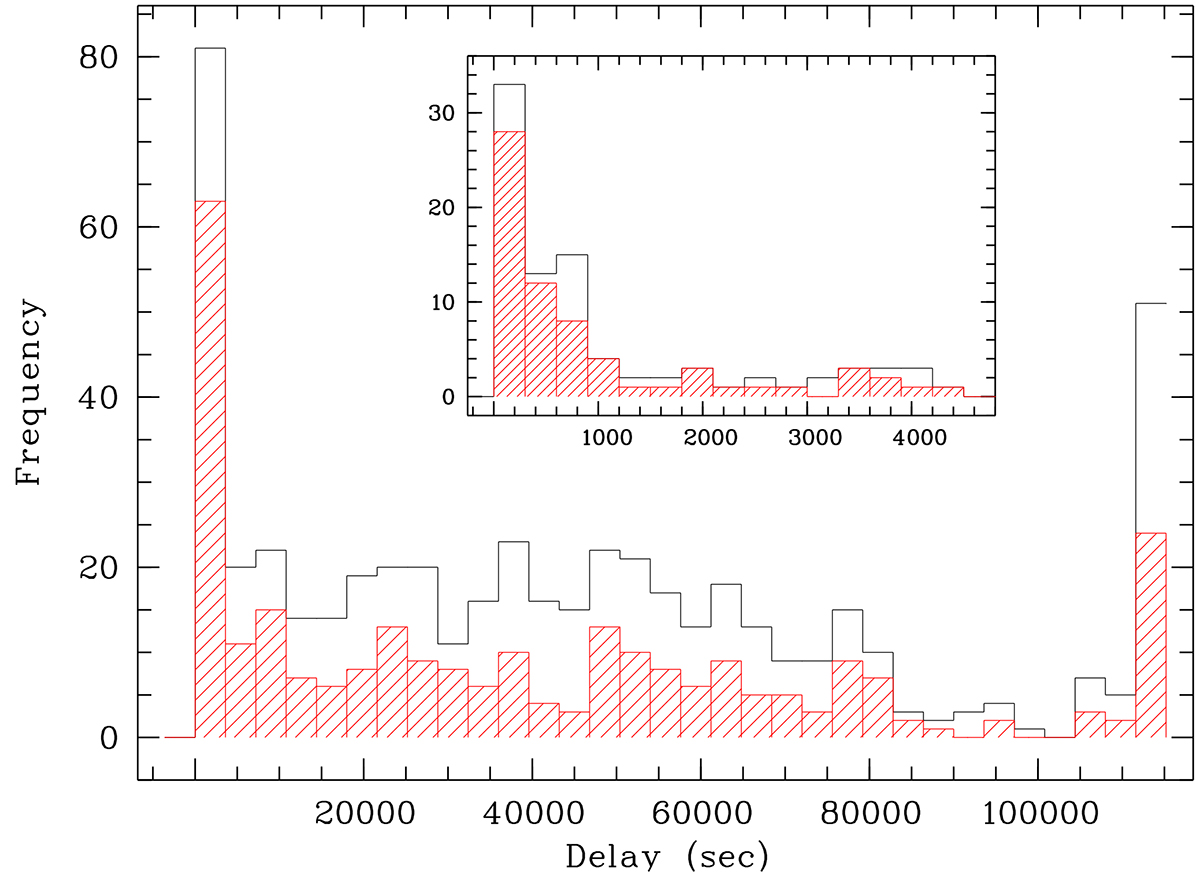
Histogram of the time between GRB alert and start of the GROND observation in 1 hr bins, showing all 514 GRBs (black), and those with optical afterglow detection (red). The inset shows a zoom of the distribution during the first hour, in 5 min bins. The fastest reaction time was 78 s (for GRB 130514A).
Current usage metrics show cumulative count of Article Views (full-text article views including HTML views, PDF and ePub downloads, according to the available data) and Abstracts Views on Vision4Press platform.
Data correspond to usage on the plateform after 2015. The current usage metrics is available 48-96 hours after online publication and is updated daily on week days.
Initial download of the metrics may take a while.