Fig. A.11.
Download original image
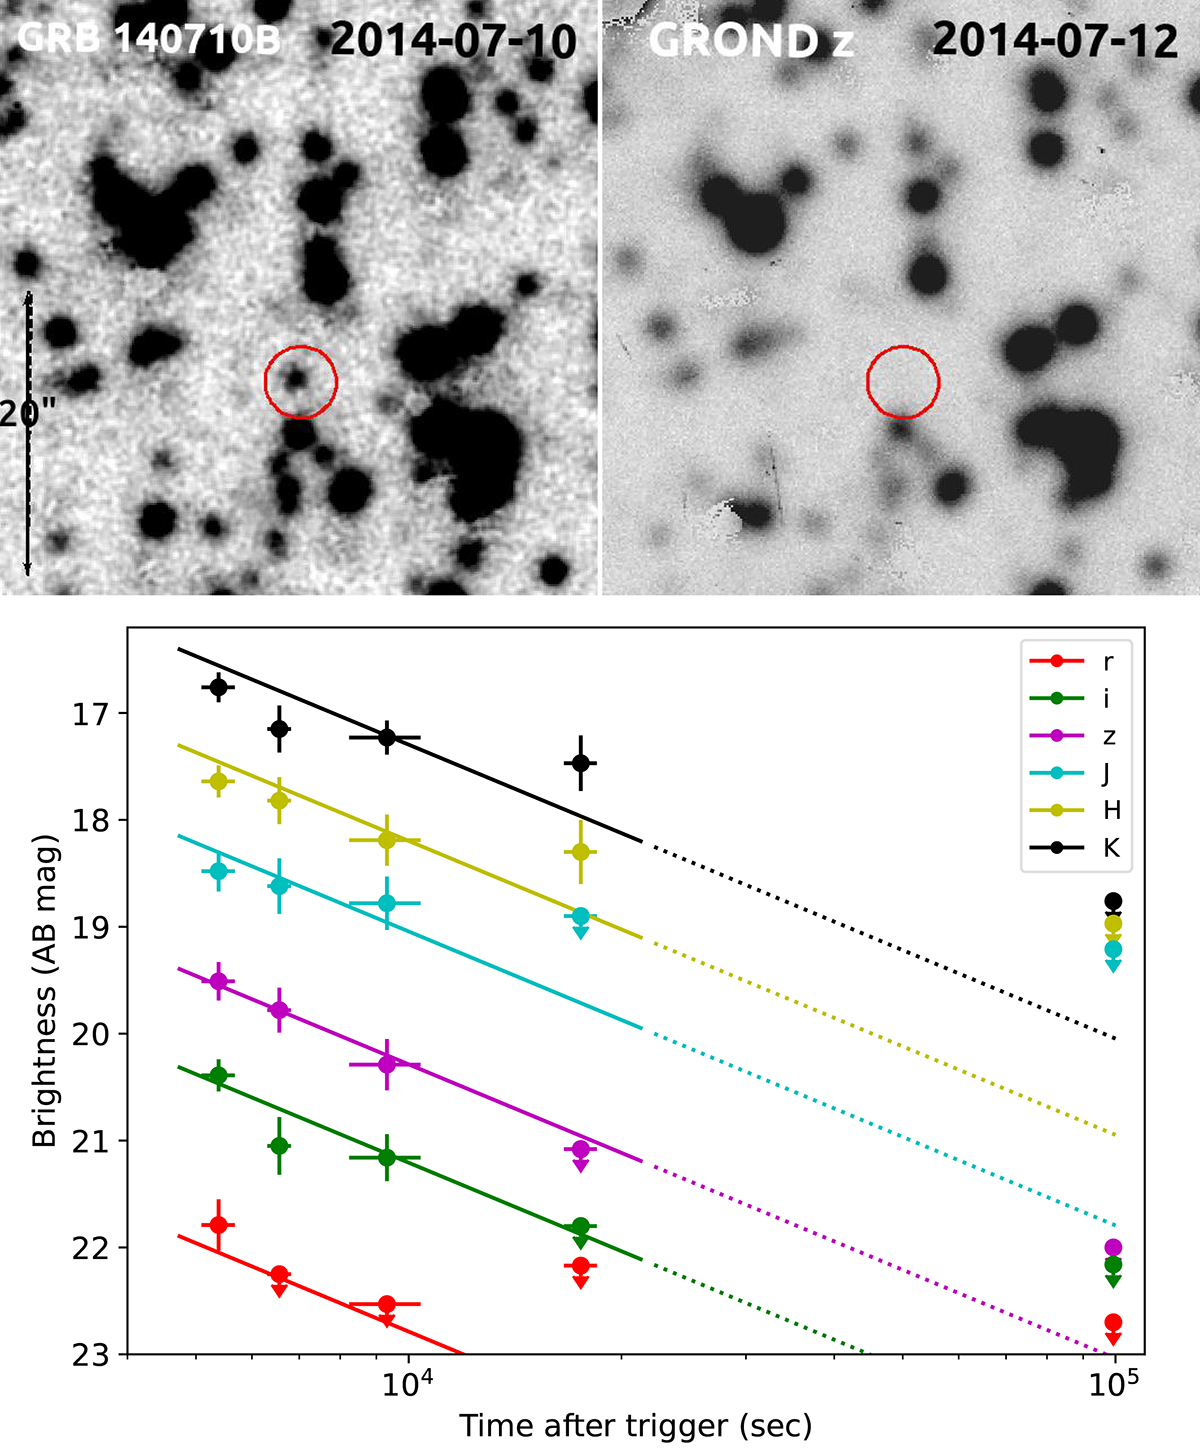
GROND z′-band image from the first 10 min OB from the first night (top left; mid-time 2014-07-10T23:09), the stack of two 30 min OBs from the next night (top right’ mid-time 2014-07-12T01:13), and the GROND light curve with a best-fit slope of 1.2±0.1 (bottom). The 1.′7 INTEGRAL error circle is outside this figure, but the combined evidence of clear fading and typical power-law SED identifies this source without doubt as the afterglow of GRB 140710B.
Current usage metrics show cumulative count of Article Views (full-text article views including HTML views, PDF and ePub downloads, according to the available data) and Abstracts Views on Vision4Press platform.
Data correspond to usage on the plateform after 2015. The current usage metrics is available 48-96 hours after online publication and is updated daily on week days.
Initial download of the metrics may take a while.