Open Access
Fig. A.9.
Download original image
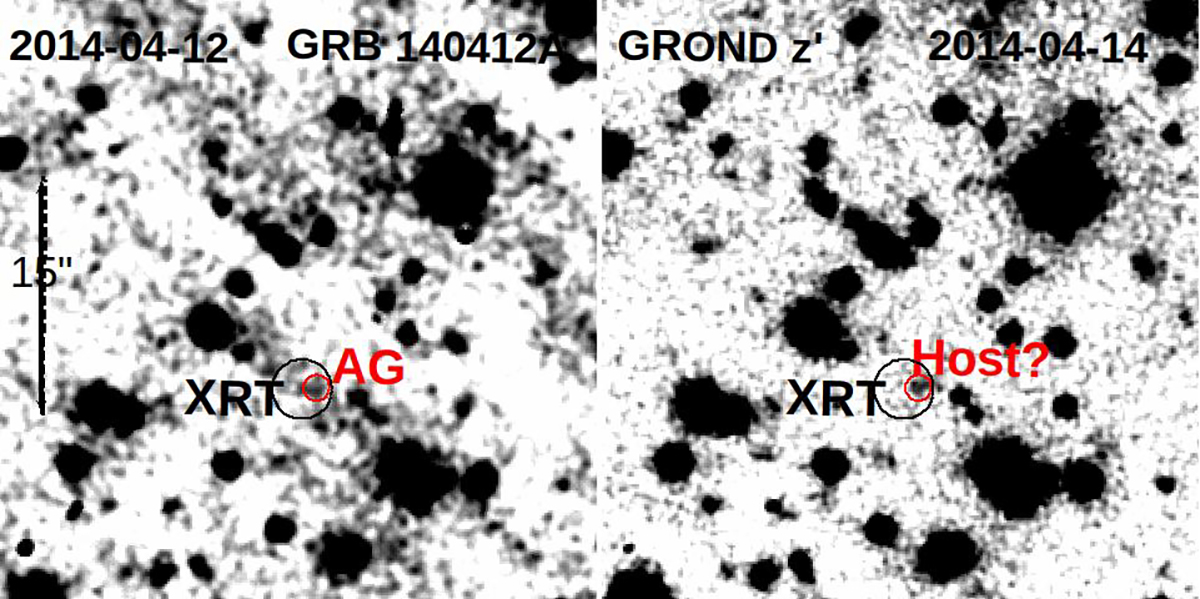
GROND images from the co-add of 25 min from the first night (left, afterglow) and 100 min of the third night (right, host). The black circle denotes the Swift/XRT position of the X-ray afterglow of GRB 140412A, and the red circle marks the position of the afterglow and host.
Current usage metrics show cumulative count of Article Views (full-text article views including HTML views, PDF and ePub downloads, according to the available data) and Abstracts Views on Vision4Press platform.
Data correspond to usage on the plateform after 2015. The current usage metrics is available 48-96 hours after online publication and is updated daily on week days.
Initial download of the metrics may take a while.