Fig. 5.
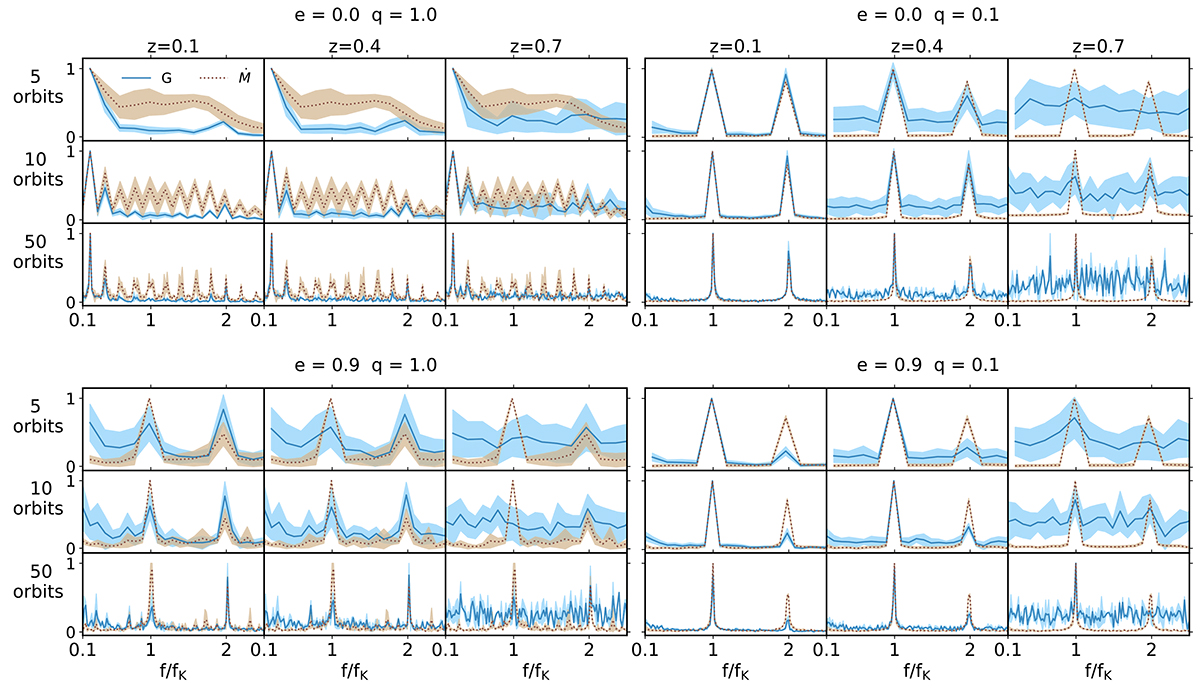
Download original image
Fast Fourier transform of LCs from simulations. The top panels are for simulations of circular binaries, while the bottom panels are for simulations of eccentric e = 0.9 binaries. The left and right columns are for binaries with q = 1 and q = 0.1, respectively. The first row of each case shows the FFT of the Optical G band flux (blue line) and the FFT of the accretion rate (brown line) computed over 5-orbit windows within a total of 300/400 orbital periods at redshift z = 0.1, 0.4, 0.7. The second and the third rows show the FFT computed over 10- and 50-orbit windows, respectively.
Current usage metrics show cumulative count of Article Views (full-text article views including HTML views, PDF and ePub downloads, according to the available data) and Abstracts Views on Vision4Press platform.
Data correspond to usage on the plateform after 2015. The current usage metrics is available 48-96 hours after online publication and is updated daily on week days.
Initial download of the metrics may take a while.