Fig. 3.
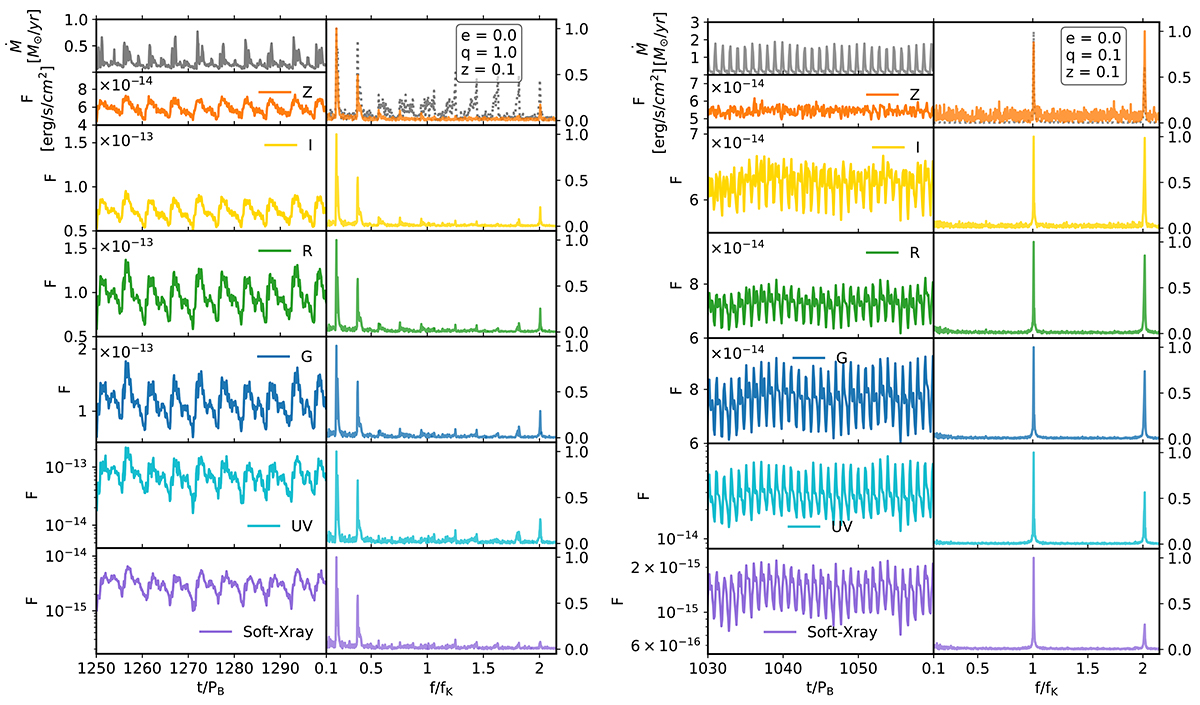
Download original image
Light curves and their FFT for circular mass binaries at z = 0.1. The left and right panels are for binaries with q = 1 and q = 0.1, respectively. In each panel, the first row shows the accretion rate (grey line) and the flux (orange line) integrated over the whole frequency range we consider (108 − 2.8 × 10¹⁹ Hz). The left column shows the flux evolution in time while the right column shows the FFT of the accretion rate and flux over 300 orbits in the time window t = 1000 − 1300 PB (left panel) or t = 760 − 1060 PB (right panel), normalised to unity, in function of f/fK with fK the Keplerian frequency of the binary. The second, third, and fourth rows show the flux and FFT in the optical Z band, UV band, and soft X-ray band, respectively. The optical flux was computed taking into account an extra Gaussian noise component, as is described in Sect. 2.2.
Current usage metrics show cumulative count of Article Views (full-text article views including HTML views, PDF and ePub downloads, according to the available data) and Abstracts Views on Vision4Press platform.
Data correspond to usage on the plateform after 2015. The current usage metrics is available 48-96 hours after online publication and is updated daily on week days.
Initial download of the metrics may take a while.