Fig. 2.
Download original image
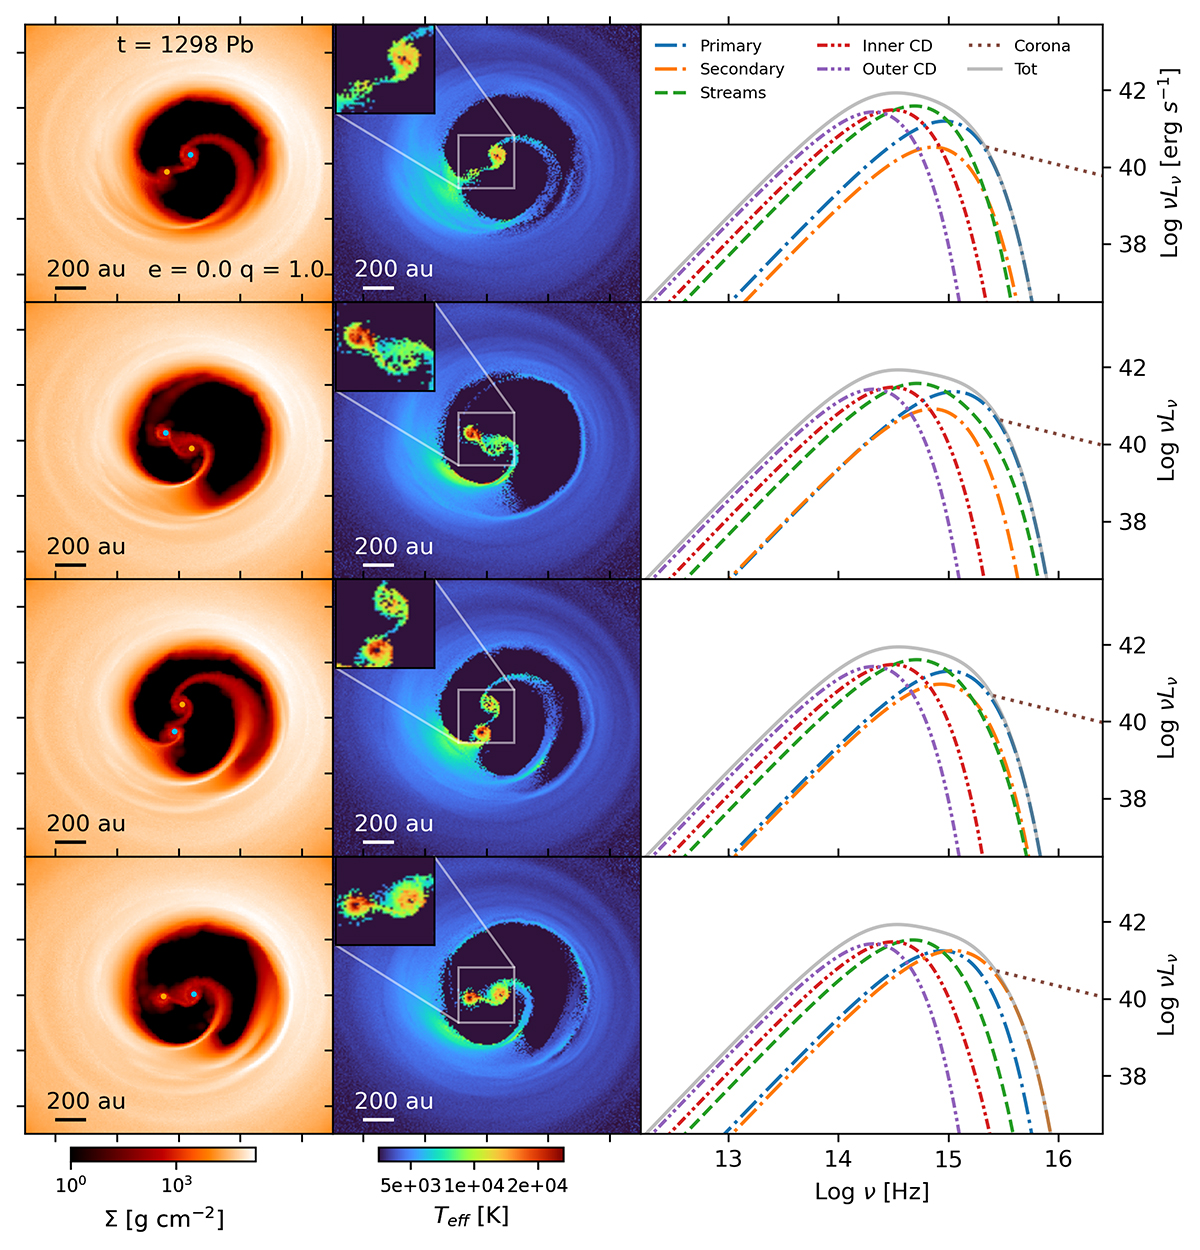
Surface density map, effective temperature map and SEDs for a circular equal-mass binary. From the top to the bottom row: the binary at four different orbital phases at time t = 1298 Pb. The left, middle, and right panels in each row show the surface density map in the x − y plane, the effective temperature map in the x − y plane and the SEDs. The tick spacing on the x and y axes in the left and central panels is 2a0, where a0 is the initial binary semi-major axis. The surface density upper limit is set at 1.8 × 10⁵ g cm−2. In the SEDs, the contribution of the mini-discs around the primary and the secondary black hole is shown by the dash-dotted blue and orange lines, respectively, the stream region is represented by the dashed green line while the inner and outer part of the circumbinary disc are represented by the dash-dotted red and purple lines, respectively. The corona contribution is shown by the dotted brown line. The solid grey line shows the total emitted spectrum.
Current usage metrics show cumulative count of Article Views (full-text article views including HTML views, PDF and ePub downloads, according to the available data) and Abstracts Views on Vision4Press platform.
Data correspond to usage on the plateform after 2015. The current usage metrics is available 48-96 hours after online publication and is updated daily on week days.
Initial download of the metrics may take a while.