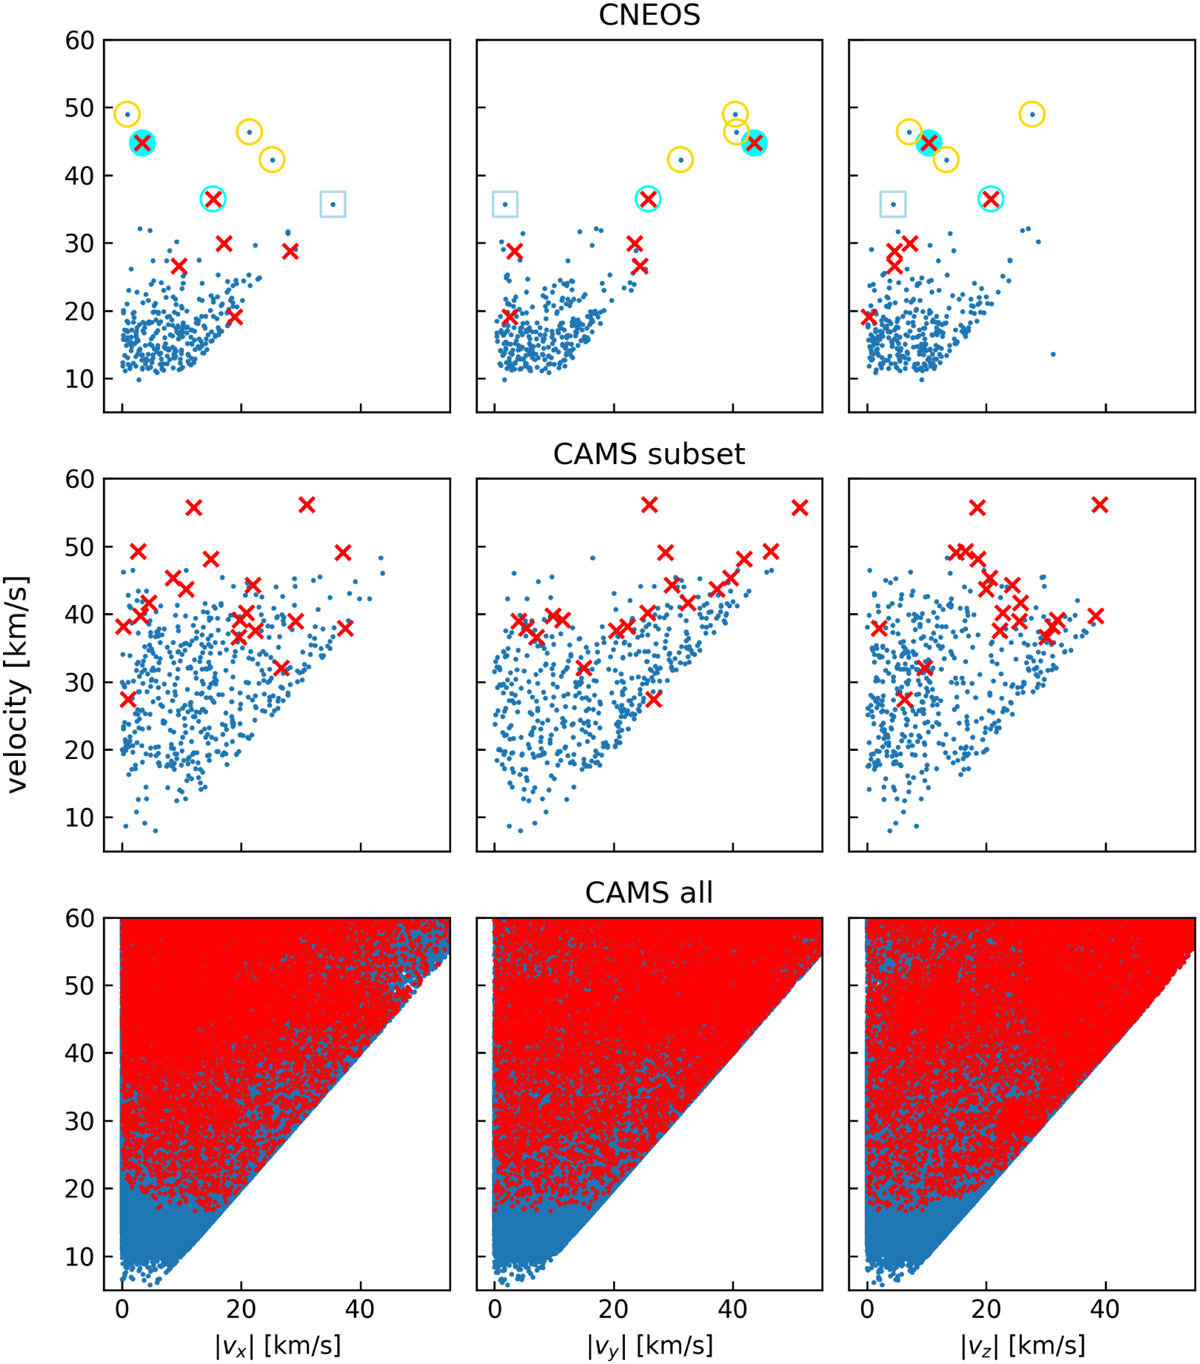
Fig. 5
Download original image
Relation between the total velocity and the absolute value of υx, υy, and υz components for the CNEOS catalog compared with the CAMS data. All hyperbolic events are marked with red crosses, elliptical orbits are shown with blue dots. In the CNEOS data (top row), the symbols are consistent with those in previous figures. For a rough comparison, a subset of 484 sporadic events with prograde orbits (inclination less than 60 degrees) and peak brightness greater than −3 mag was generated from the CAMS database (middle row), approximating the population of CNEOS fireballs. The bottom row displays all CAMS data corresponding to the offset provided by the axis alignment.
Current usage metrics show cumulative count of Article Views (full-text article views including HTML views, PDF and ePub downloads, according to the available data) and Abstracts Views on Vision4Press platform.
Data correspond to usage on the plateform after 2015. The current usage metrics is available 48-96 hours after online publication and is updated daily on week days.
Initial download of the metrics may take a while.