Fig. 3
Download original image
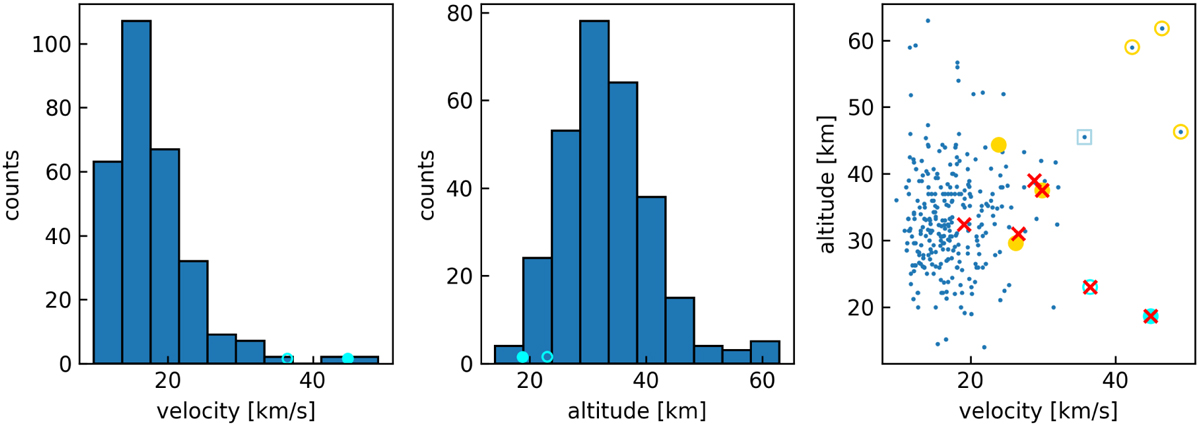
Histograms of velocities (left panel) and altitudes (middle panel) for all CNEOS events. The two interstellar candidates are color coded as filled (IMC1) and empty (IMC2) cyan dots. The right panel shows the altitude–velocity scatter plot, in which six events (including the both interstellar candidates) have significantly deviated from the bulk of the events. The hyperbolic fireballs are marked as red crosses. Events with large deviations in the υy velocity component are shown in orange. The empty square is the CNEOS event 2015-01-07, for which the velocity was overestimated by 30% (Borovička et al. 2017).
Current usage metrics show cumulative count of Article Views (full-text article views including HTML views, PDF and ePub downloads, according to the available data) and Abstracts Views on Vision4Press platform.
Data correspond to usage on the plateform after 2015. The current usage metrics is available 48-96 hours after online publication and is updated daily on week days.
Initial download of the metrics may take a while.