Fig. 2
Download original image
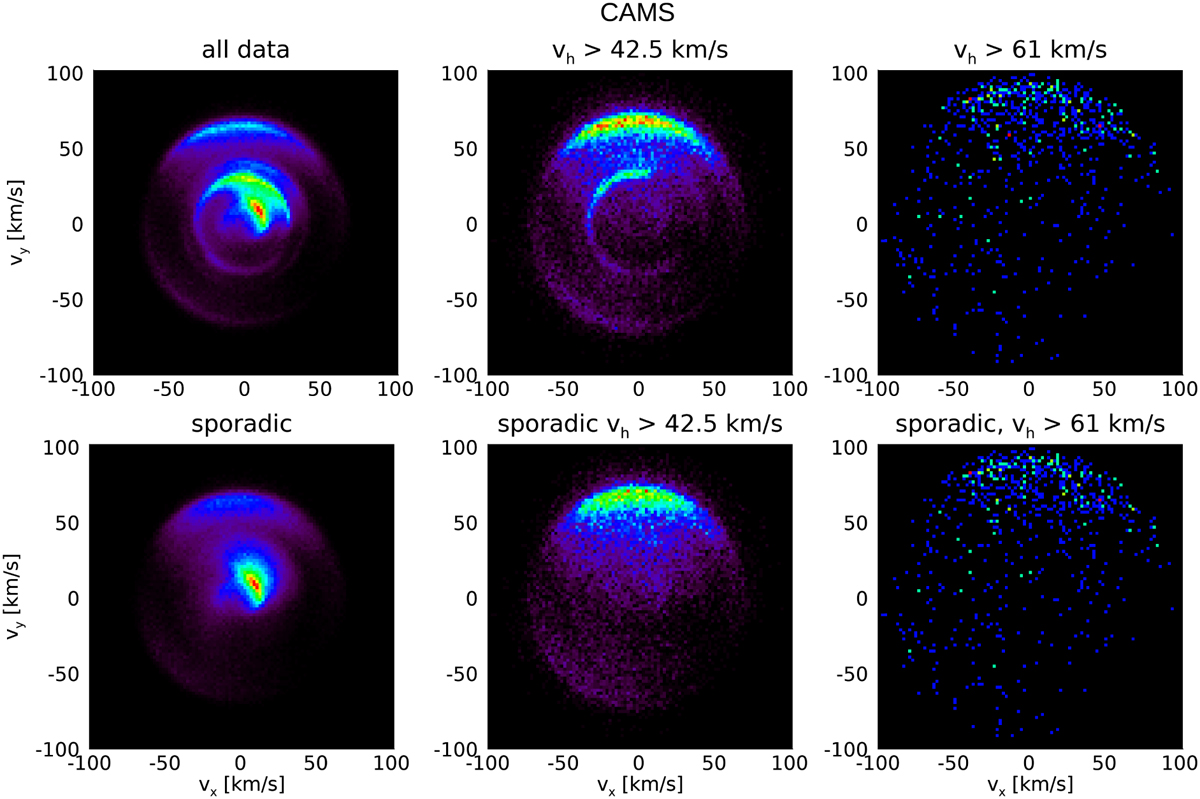
Density plots of the CAMS meteors displayed in relation between the velocity components υx and υy and shown separately for all data (upper panels) and for only sporadic meteors (lower panels). All meteors of these two samples are shown in the left panels, apparent hyperbolic orbits in the middle panels, and a subset of those with hyperbolic heliocentric velocities over 61 km s−1 in the right panels.
Current usage metrics show cumulative count of Article Views (full-text article views including HTML views, PDF and ePub downloads, according to the available data) and Abstracts Views on Vision4Press platform.
Data correspond to usage on the plateform after 2015. The current usage metrics is available 48-96 hours after online publication and is updated daily on week days.
Initial download of the metrics may take a while.