Fig. 10
Download original image
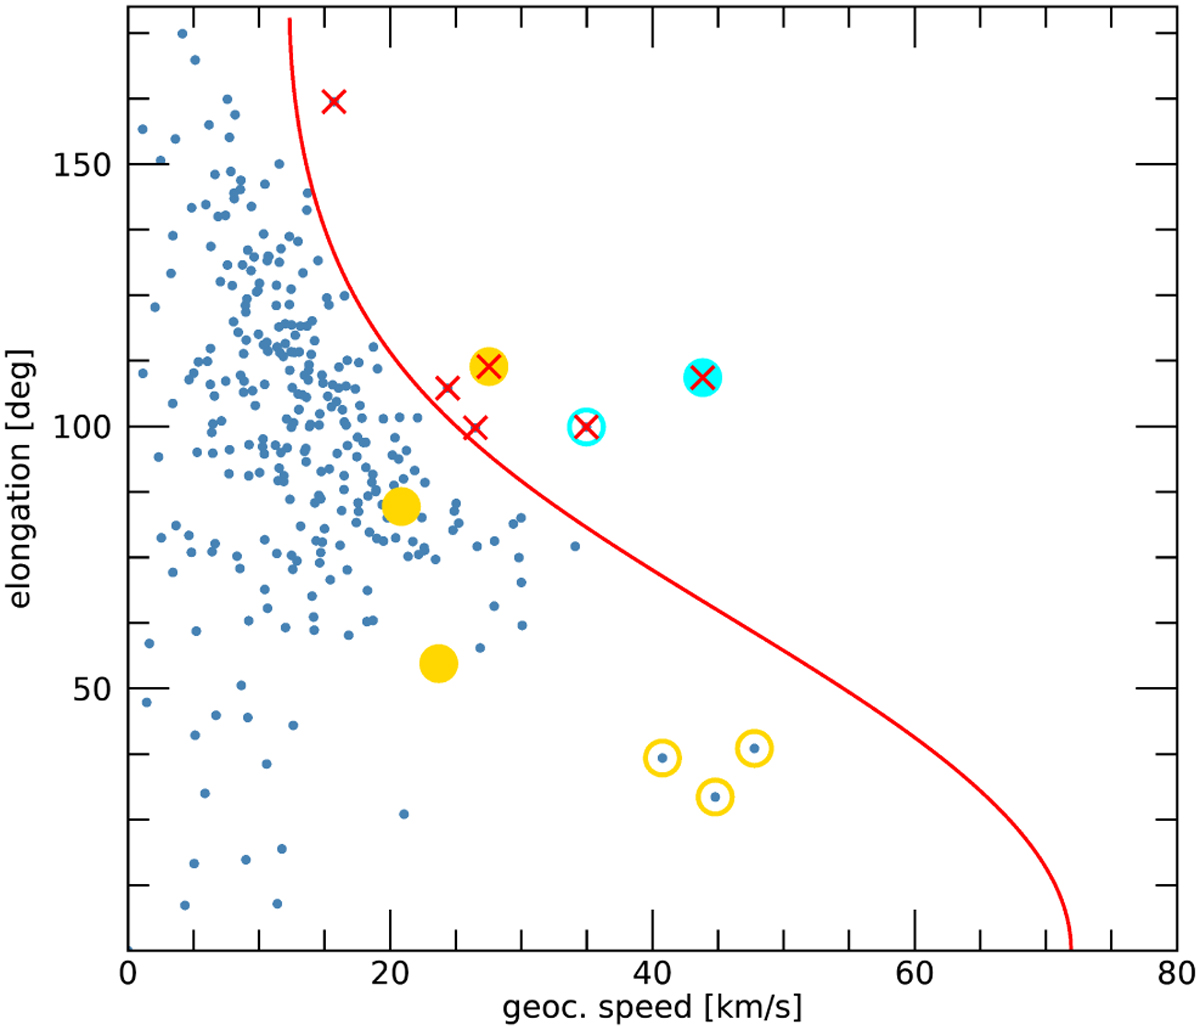
Kresaks’ diagram showing the influence of meteor measurement errors on the resulting meteoroid orbit (based on Kresák & Kresáková 1976; Hajduková et al. 2019). The angular elongation of the apparent radiant from the apex ϵA is plotted against the geocentric velocity υ𝑔 for all 291 CNEOS fireballs. The red curve represents the parabolic limit, beyond which the six hyperbolic CNEOS fireballs (marked with red crosses) are located. The IMC1 and IMC2 fireballs are indicated as full and empty cyan colored dots. The orange dots represent the other υy outliers, three of which (the empty dots around the 45 km s−1 and 40° ) correspond to extremely rare perpendicular encounters. From the resolution of the diagram, one can estimate the uncertainties in speeds and radiant positions that could create the hyper-bolicity of the event’s orbit.
Current usage metrics show cumulative count of Article Views (full-text article views including HTML views, PDF and ePub downloads, according to the available data) and Abstracts Views on Vision4Press platform.
Data correspond to usage on the plateform after 2015. The current usage metrics is available 48-96 hours after online publication and is updated daily on week days.
Initial download of the metrics may take a while.