Fig. 1
Download original image
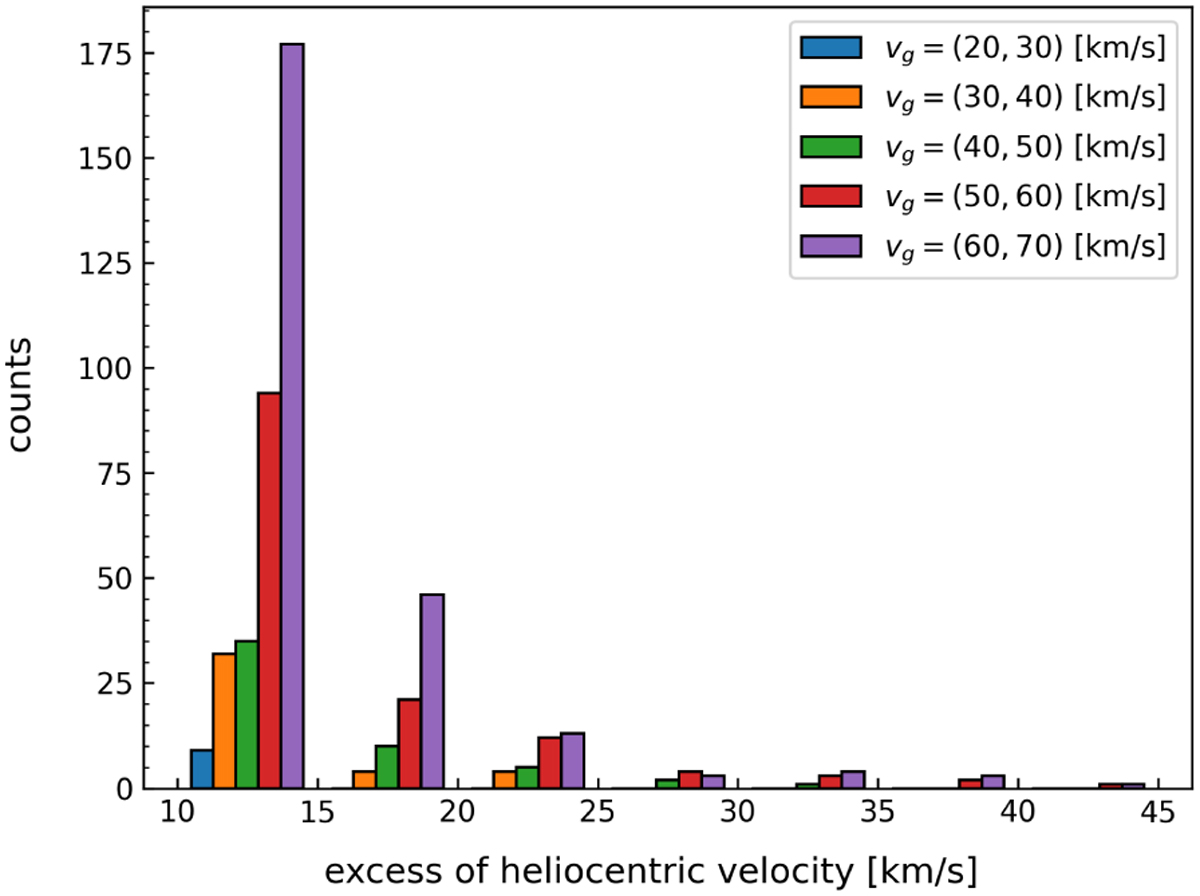
Number of hyperbolic events from the CAMS database with extreme excesses of heliocentric velocities (exceeding the parabolic limit by more than 10 km s−1) for selected intervals of their geocentric velocities υɡ. The x-axis shows the selected intervals of excess of heliocentric velocity (from 10 to 45 km s−1, with bin size 5 km s−1) and the bars illustrate the number of events for corresponding υɡ (as stated in the legend) contained within those intervals. The histograms illustrate two distinct features observed in many databases. One, the presence of hyperbolic events, including those with high heliocentric excess velocities, among meteors with low geocentric velocities. Two, the increase in the number of higher heliocentric excess velocities with increasing geocentric velocities of meteors.
Current usage metrics show cumulative count of Article Views (full-text article views including HTML views, PDF and ePub downloads, according to the available data) and Abstracts Views on Vision4Press platform.
Data correspond to usage on the plateform after 2015. The current usage metrics is available 48-96 hours after online publication and is updated daily on week days.
Initial download of the metrics may take a while.