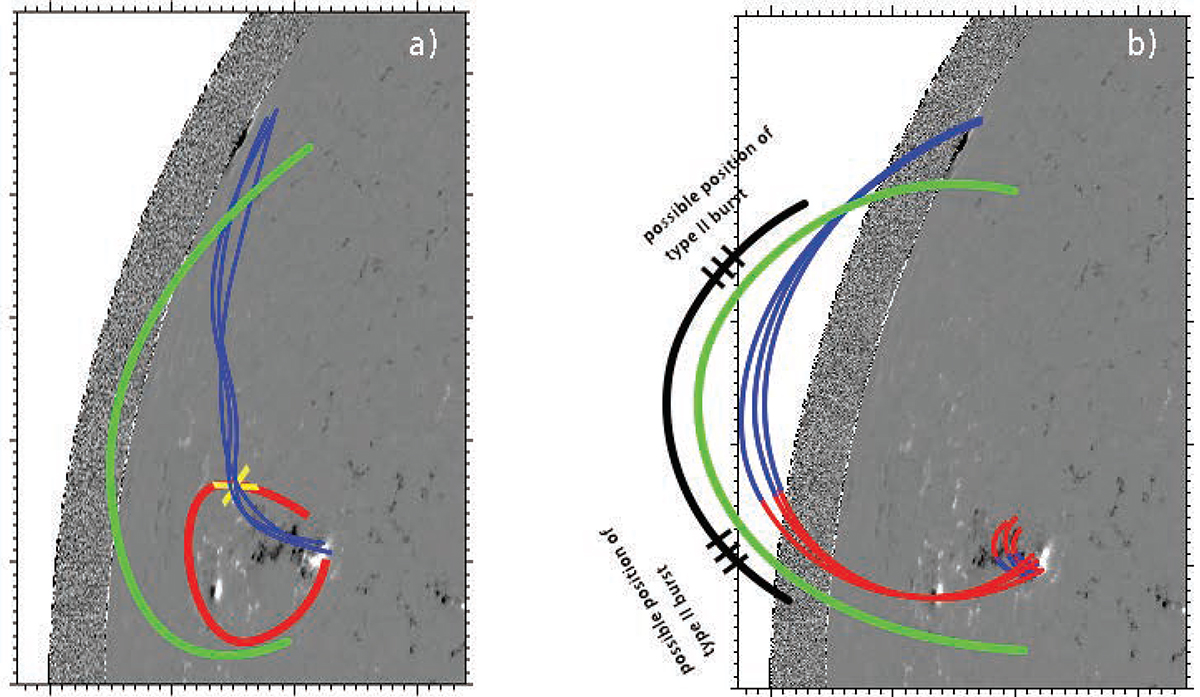
Fig. 7.

Download original image
Scenario of the type II burst associated with filament–filament interaction. (a) Overview of the filament–filament interaction. The red line indicates erupting F1. The blue lines indicate erupting F2. The green line indicates the overlying loops constraining two filaments. The yellow “X” indicates the interaction between the erupting F1 and F2. (b) Formation of the type II burst. The lines change from red to blue and the lines change from blue to red indicate the productions of the magnetic reconnection between F1 and F2. Green and black lines indicate the CME and CME-driven shock, respectively. The possible location of the type II burst is marked on the flank of the shock wave.
Current usage metrics show cumulative count of Article Views (full-text article views including HTML views, PDF and ePub downloads, according to the available data) and Abstracts Views on Vision4Press platform.
Data correspond to usage on the plateform after 2015. The current usage metrics is available 48-96 hours after online publication and is updated daily on week days.
Initial download of the metrics may take a while.


