Fig. 6.
Download original image
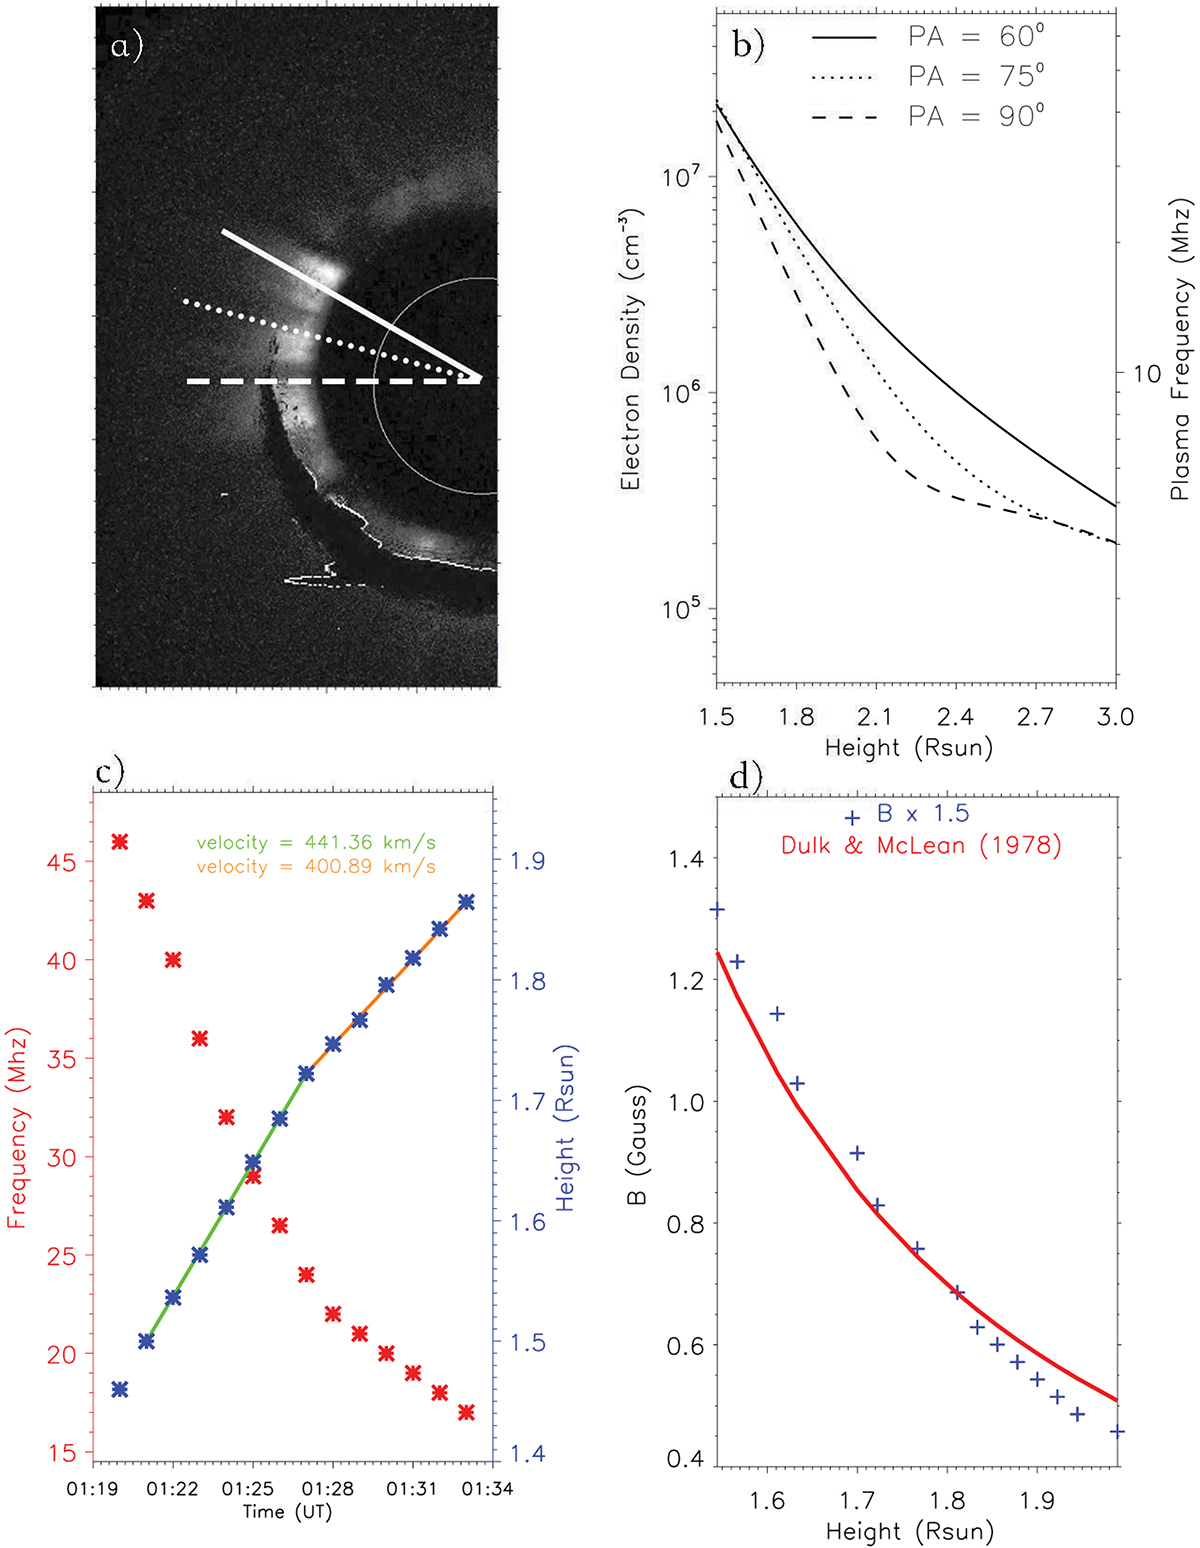
Kinematics analysis of the type II burst. (a) pB data recorded by STEREO COR1 coronagraph at 01:00 UT on 2023 September 11. The soiled, dotted, and dashed lines are separately at the PAs of 60, 75, and 90 degrees. (b) Profile of coronal electron density distribution and corresponding radio frequency along three PAs deduced from STEREO COR1 pB data. (c) Frequency of the type II burst (red asterisk) and deduced shock height (blue asterisk). The lineally fitted shock speed (green and blue lines). The first blue asterisk indicates the extrapolated initial shock height (d) Value of inferred magnetic field strength based on the band-splitting phenomenon in the UD scenario multiplied by 1.5 (blue plus symbol). The empirical model is that proposed by Dulk & McLean (1978) (red curve).
Current usage metrics show cumulative count of Article Views (full-text article views including HTML views, PDF and ePub downloads, according to the available data) and Abstracts Views on Vision4Press platform.
Data correspond to usage on the plateform after 2015. The current usage metrics is available 48-96 hours after online publication and is updated daily on week days.
Initial download of the metrics may take a while.