Open Access
Fig. 4.
Download original image
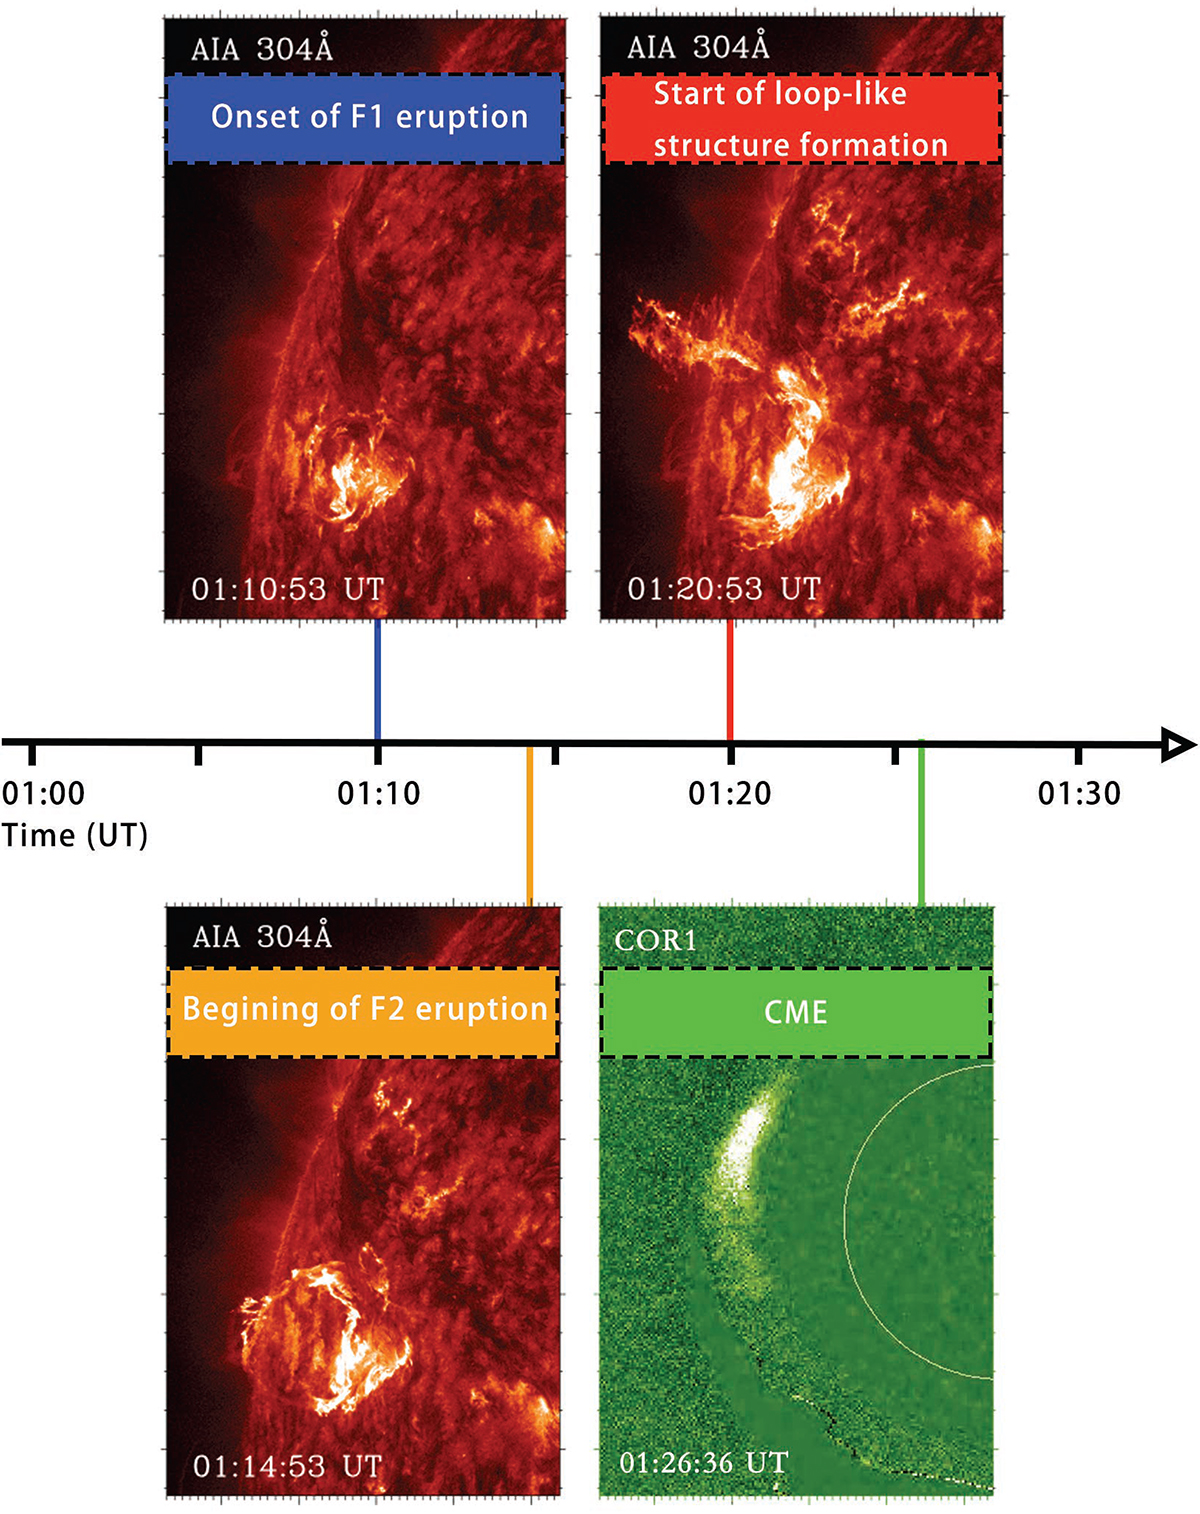
Timeline of the main phase of the event. The start time of the eruption of F1, the eruption of F2, the formation of loop-like structures, and the CME appearing above the occulting disk of COR1 are marked on the time axis.
Current usage metrics show cumulative count of Article Views (full-text article views including HTML views, PDF and ePub downloads, according to the available data) and Abstracts Views on Vision4Press platform.
Data correspond to usage on the plateform after 2015. The current usage metrics is available 48-96 hours after online publication and is updated daily on week days.
Initial download of the metrics may take a while.