Fig. 3.
Download original image
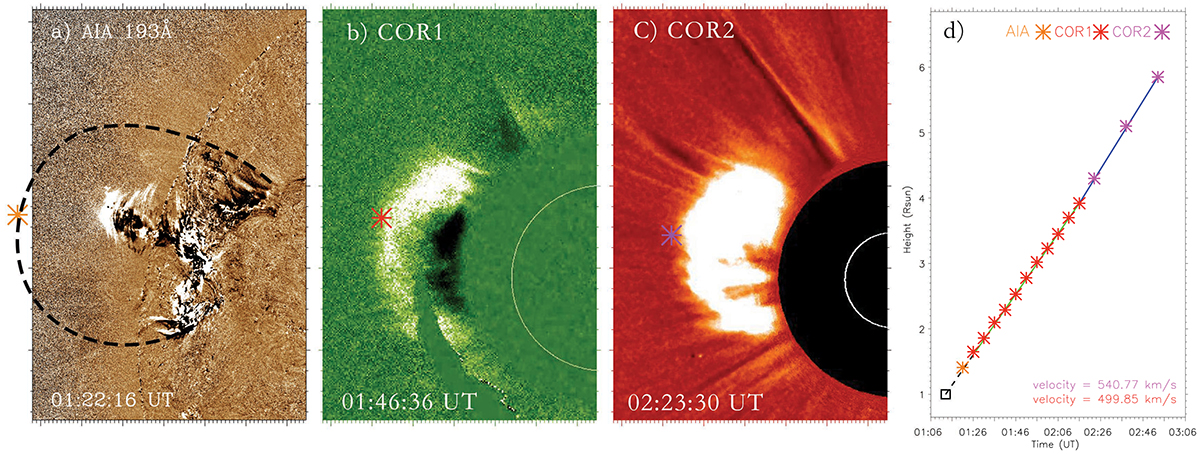
Evolution and kinematics analysis of the CME. (a) The black dashed line indicates the large-scale expanding loops in AIA 193 Å. (b) CME as seen by the COR1 coronagraph. (c) CME as seen by the COR2 coronagraph. (d) Time–height plots of the CME. The asterisk indicates the height. The green and blue lines indicate the lineally fitted speed. The black dashed line and square indicate the extrapolated onset time of the CME to 1 R⊙. An animation of the evolution of the CME is available online. The animated sequence runs from 01:00 UT to 03:00 UT on 2023 September 11 and its real-time duration is 13 s.
Current usage metrics show cumulative count of Article Views (full-text article views including HTML views, PDF and ePub downloads, according to the available data) and Abstracts Views on Vision4Press platform.
Data correspond to usage on the plateform after 2015. The current usage metrics is available 48-96 hours after online publication and is updated daily on week days.
Initial download of the metrics may take a while.