Fig. 2.

Download original image
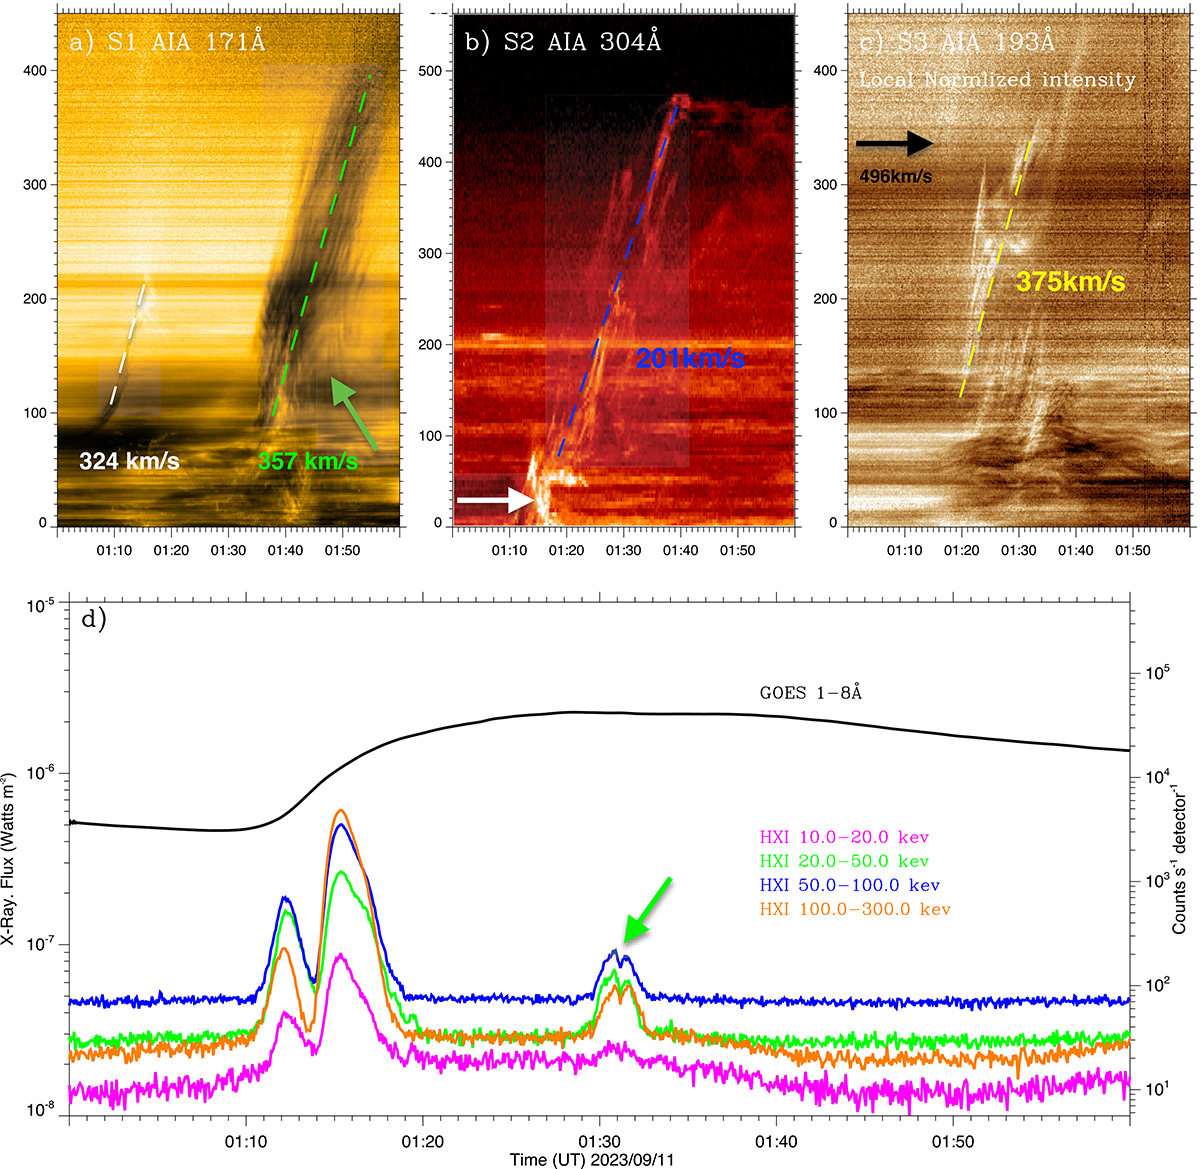
Time–distance plots along three slices. (a) S1 along the erupt direction of F1 in AIA 171 Å. The white dashed line indicates the speed of erupting F1. The green dashed line indicates the speed of the third filament eruption. (b) S2 along the erupt direction of F2 in AIA 304 Å. The blue dashed line indicates the speed of ejective F2. The white arrow indicates bright material from F1. (c) S3, which passes through the loop-like structures. The yellow dashed line indicates the speed of the loop-like structures. The black arrow indicates the speed of the large-scale expanding loops ahead of the loop-like structures. (d) The GOES 1–8 Å and ASO-S/HXI 10–300 kev flux. The green arrows indicate another filament eruption occurring in the southern part of AR 13429.
Current usage metrics show cumulative count of Article Views (full-text article views including HTML views, PDF and ePub downloads, according to the available data) and Abstracts Views on Vision4Press platform.
Data correspond to usage on the plateform after 2015. The current usage metrics is available 48-96 hours after online publication and is updated daily on week days.
Initial download of the metrics may take a while.


