Fig. 1.
Download original image
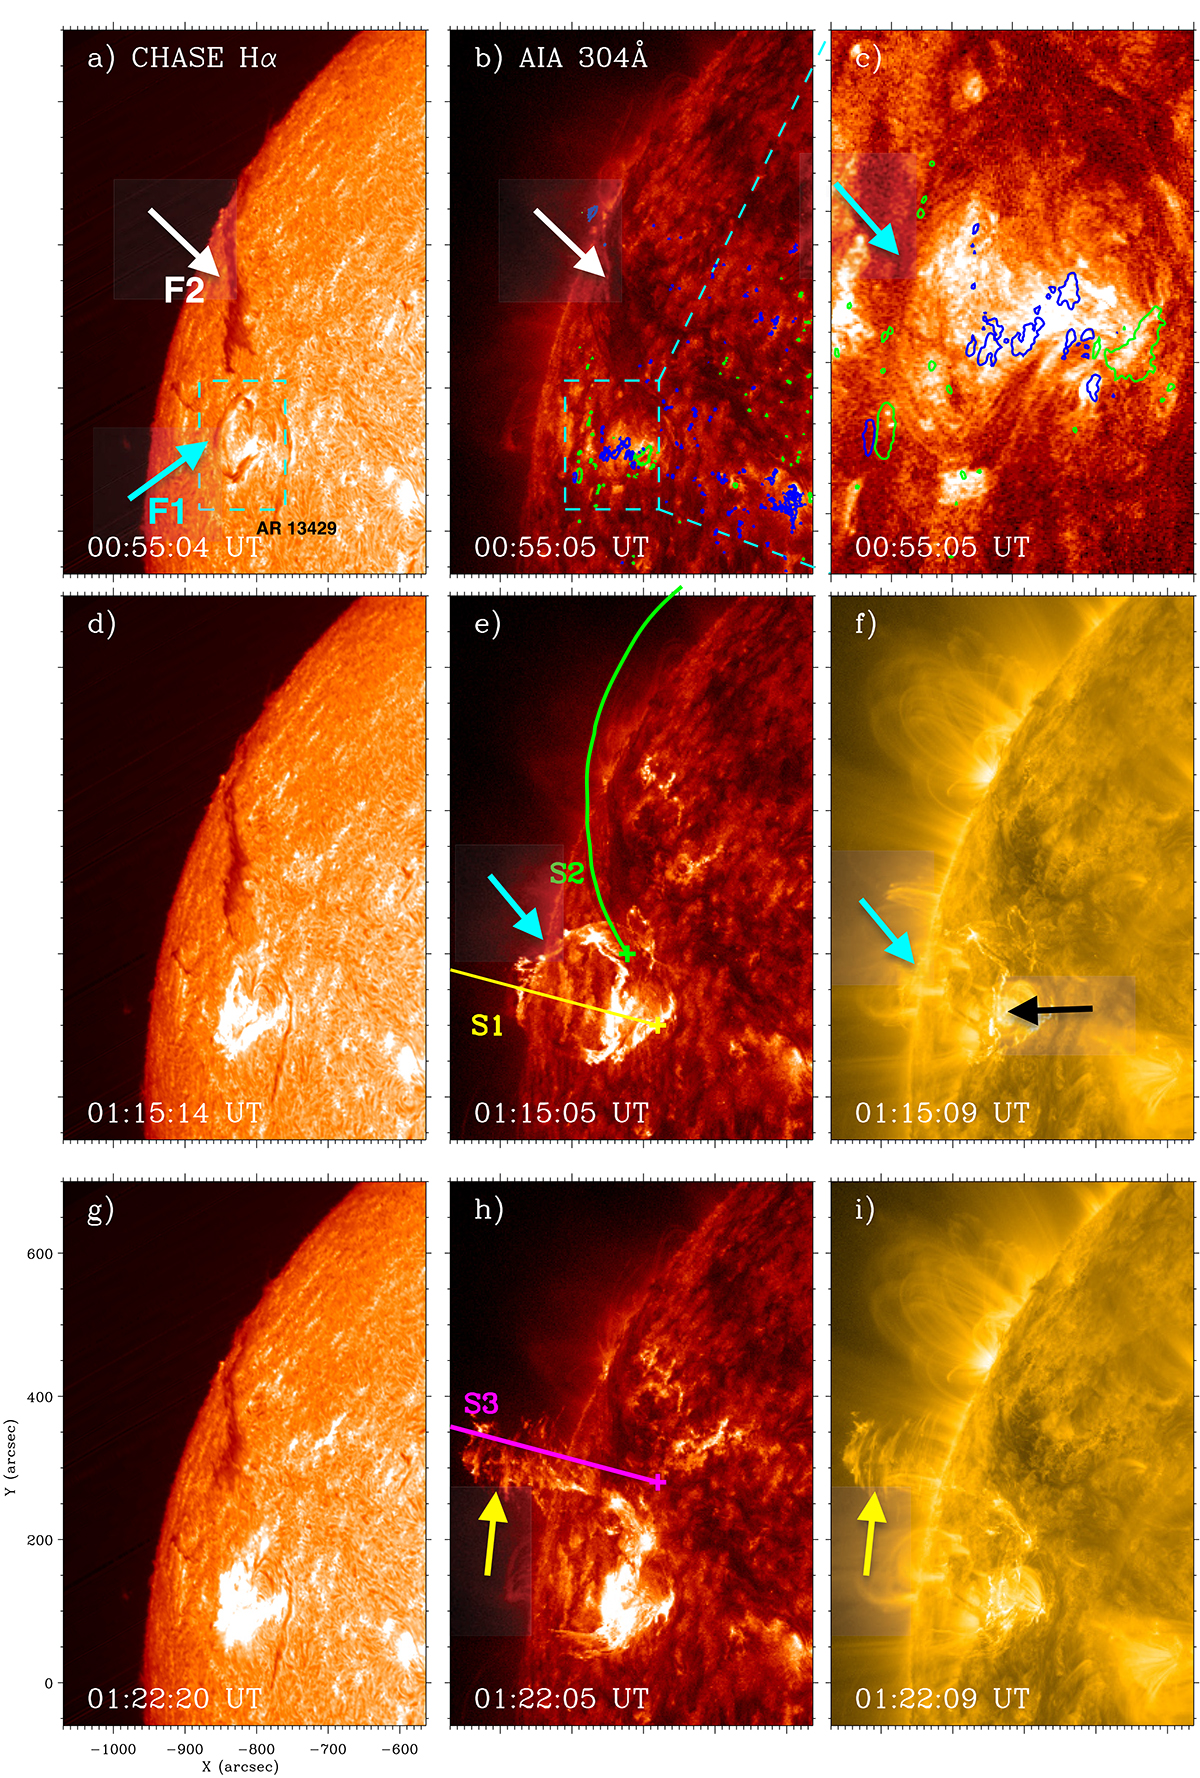
Filament–filament interaction studied here. (a)–(c): Overview of the two filaments in CHASE/HIS and AIA 304 Å maps. The white and blue arrows indicate F1 and F2. The cyan dashed box indicates the AR 13429, and the FOV of panel c. Contours of HMI magnetic field at the closest time are superposed on AIA 304 Å maps with positive (negative) fields in green (blue), and the levels for positive (negative) fields are 150 gauss. (d)–(f): Eruption of F1 and disturbance of F2 in CHASE/HIS, AIA 304 Å, and AIA 171 Å maps. The cyan arrow indicates the erupting F1. The black arrow indicates two parallel flare ribbons. (g)–(i) Filament–filament interaction and formation of loop-like structure in CHASE/HIS, AIA 304 Å, and AIA 171 Å maps. The yellow arrows indicate the loop-like structure. An animation of the filament–filament interaction is available online. The animated sequence runs from 00:55 UT to 02:00 UT on 2023 September 11 and its real-time duration is 13 s.
Current usage metrics show cumulative count of Article Views (full-text article views including HTML views, PDF and ePub downloads, according to the available data) and Abstracts Views on Vision4Press platform.
Data correspond to usage on the plateform after 2015. The current usage metrics is available 48-96 hours after online publication and is updated daily on week days.
Initial download of the metrics may take a while.