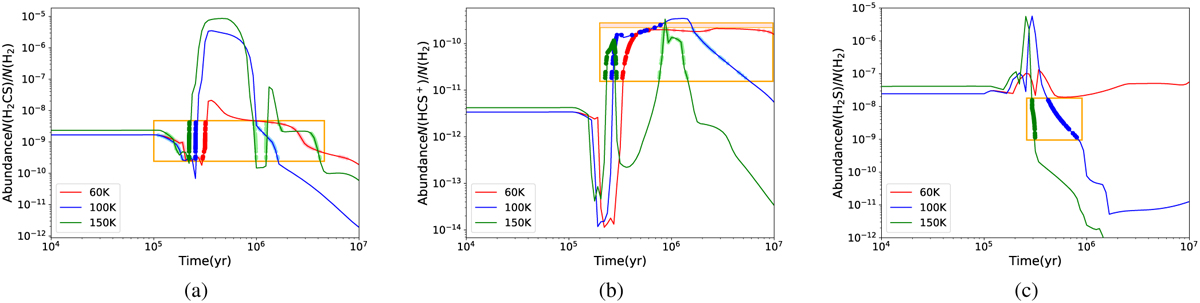
Fig. 7
Download original image
Chemical model including the gas, the dust grain surface and the icy mantle. The solid lines correspond to the gas-phase abundances versus time during warm-up stages in chemical models with gas maximum temperatures of 60, 100, and 150 K, and the points are the observed data. The abundances of H2CS, HCS+ and H2S relative to H2 are presented in panels (a), (b), and (c), respectively. Since the samples are in the same evolutionary stage, two possible times from the form model are marked, with filled and transparent circles. Note that there are no intersections for H2S at 60 K in model.
Current usage metrics show cumulative count of Article Views (full-text article views including HTML views, PDF and ePub downloads, according to the available data) and Abstracts Views on Vision4Press platform.
Data correspond to usage on the plateform after 2015. The current usage metrics is available 48-96 hours after online publication and is updated daily on week days.
Initial download of the metrics may take a while.