Fig. 5
Download original image
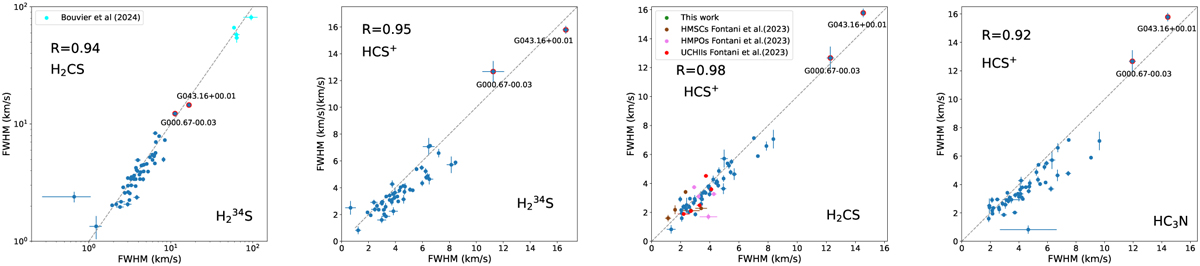
Comparison of the line FWHMs of the observed species. In all plots, the two distant blue points with red circles represent G000.67-00.03 (Srg B2) and G043.16+00.01 (W49N). The number in the upper-left corner of each panel is the Pearson correlation coefficient, ρ. The gray line is y=x. The ratios from Bouvier et al. (2024) and Fontani et al. (2023) are also presented.
Current usage metrics show cumulative count of Article Views (full-text article views including HTML views, PDF and ePub downloads, according to the available data) and Abstracts Views on Vision4Press platform.
Data correspond to usage on the plateform after 2015. The current usage metrics is available 48-96 hours after online publication and is updated daily on week days.
Initial download of the metrics may take a while.