Open Access
Fig. 4
Download original image
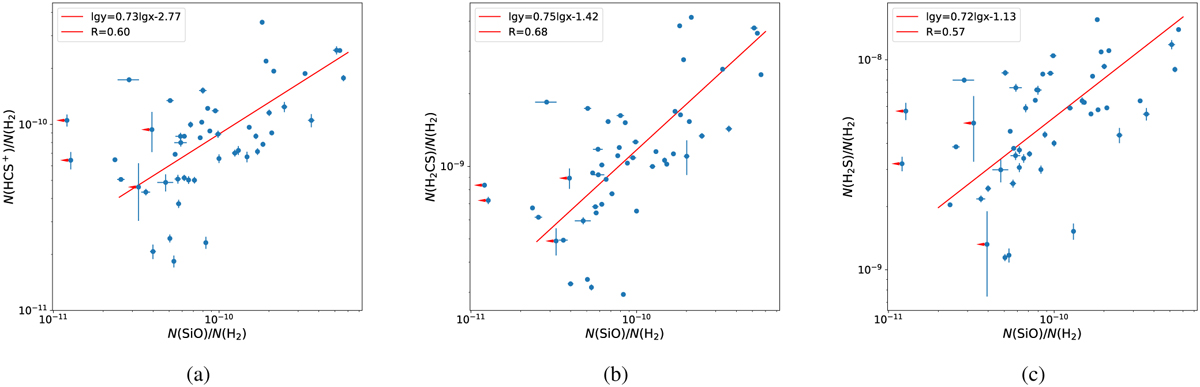
Relationships between the HCS+ and SiO abundances (a), H2CS and SiO abundances (b), and H2S and SiO abundances (c), all normalized by H2. The fitting lines, generated using the least square method, are marked in red. The four points marked with red arrows are realistic upper limits of SiO and were not used in the fitting.
Current usage metrics show cumulative count of Article Views (full-text article views including HTML views, PDF and ePub downloads, according to the available data) and Abstracts Views on Vision4Press platform.
Data correspond to usage on the plateform after 2015. The current usage metrics is available 48-96 hours after online publication and is updated daily on week days.
Initial download of the metrics may take a while.