Open Access
Fig. 2
Download original image
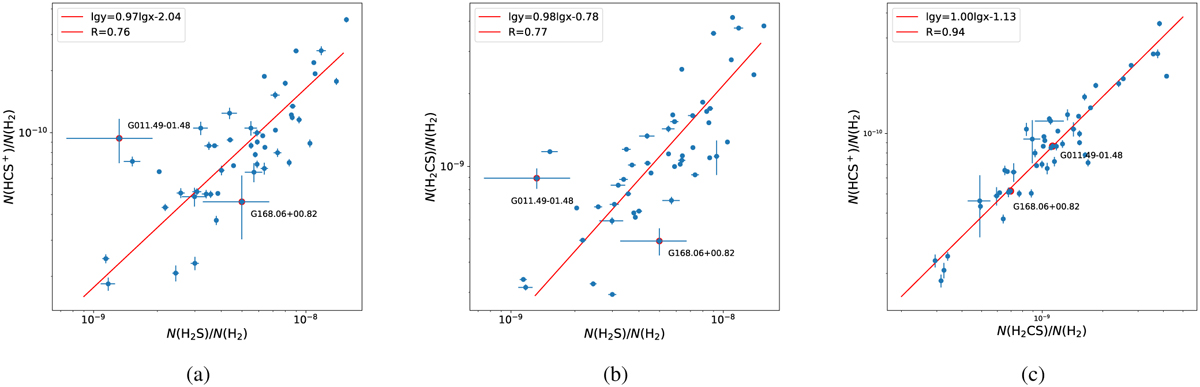
Relationship between the HCS+ and H2S abundances (a), H2CS and H2S abundances (b), and HCS+ and H2CS abundances (c), all normalized by H2. The fitting lines, generated using the least square method, are marked in red. G011.49-01.48 and G0168.06+00.82, which have large errors, are marked where H234S lines show weak emission.
Current usage metrics show cumulative count of Article Views (full-text article views including HTML views, PDF and ePub downloads, according to the available data) and Abstracts Views on Vision4Press platform.
Data correspond to usage on the plateform after 2015. The current usage metrics is available 48-96 hours after online publication and is updated daily on week days.
Initial download of the metrics may take a while.