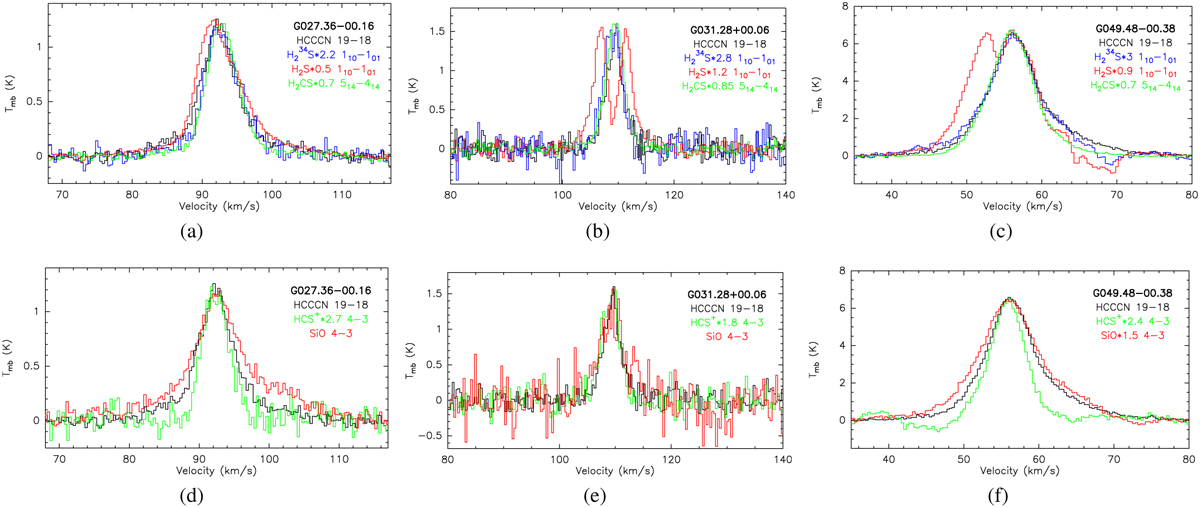
Fig. 1
Download original image
Spectra of H2S 110-101, H234S 110 -101, and H2CS 514-414 detected with IRAM for three sources (a, b and c) and HCS+ 4-3 and SiO 4-3 lines (d, e and f). All of the observed spectra are aligned to the peak of HC3N 19-18. In panels (a), (b), and (c), red lines are H2S 110-101, blue lines are H234S 110-101, and green lines are H2CS 514-414. In (d), (e), and (f), HCS+ 4-3 lines are in green and SiO 4-3 lines are red. The black lines in all panels represent HC3N.
Current usage metrics show cumulative count of Article Views (full-text article views including HTML views, PDF and ePub downloads, according to the available data) and Abstracts Views on Vision4Press platform.
Data correspond to usage on the plateform after 2015. The current usage metrics is available 48-96 hours after online publication and is updated daily on week days.
Initial download of the metrics may take a while.