Fig. 9
Download original image
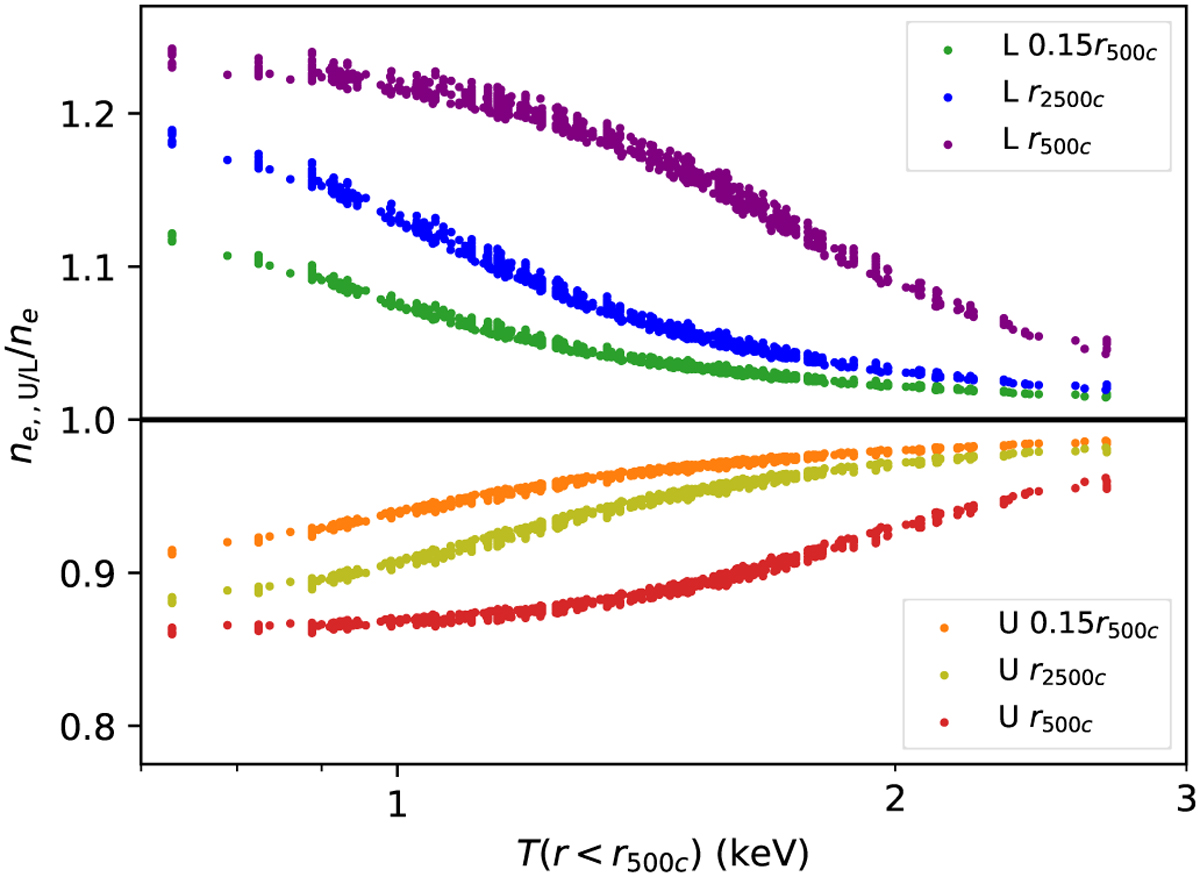
Ratio of the electron densities obtained by assuming low/up-scattered Mernier et al. (2017) metallicity profiles to the electron densities obtained by the median Mernier et al. (2017) metallicity profile at three radii, 0.15r500c, r2500c, and r500c as a function of characteristic temperature, T(r < r500c). Green, blue, and purple data points represent the ratio between the electron densities obtained by assuming the lower envelope (ne,L) of the red shared area and the dark red median line (ne) in Fig. 8. Orange, yellow, and red data points represent the ratio between the electron densities obtained by assuming the upper envelope of the red shared area (ne,U) and the dark red median line (ne) in Fig. 8.
Current usage metrics show cumulative count of Article Views (full-text article views including HTML views, PDF and ePub downloads, according to the available data) and Abstracts Views on Vision4Press platform.
Data correspond to usage on the plateform after 2015. The current usage metrics is available 48-96 hours after online publication and is updated daily on week days.
Initial download of the metrics may take a while.