Fig. 4
Download original image
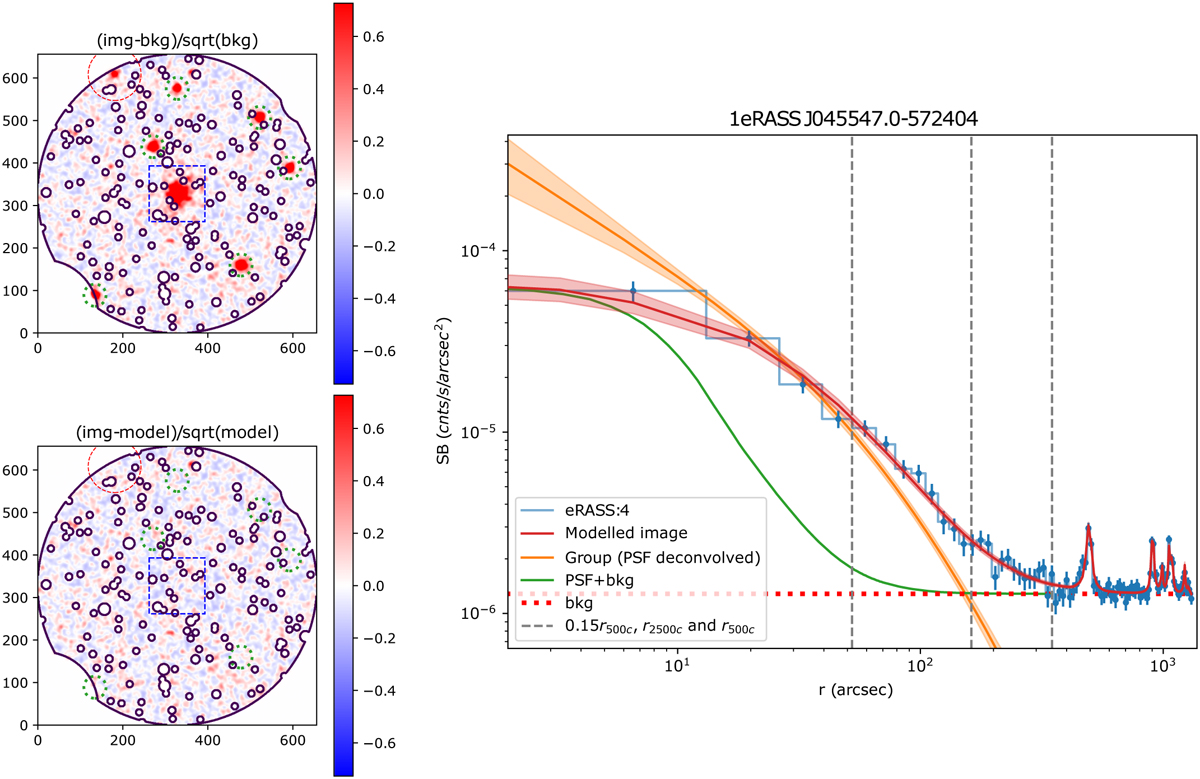
Example of the eROSITA imaging analysis for the group 1eRASS J045547.0-572404. Left: residual image of the group before and after subtracting the co-fit extended sources and point sources in the field. Nearby co-fit clusters and groups are shown with red circles, co-fit nearby bright AGN are shown with green circles, and the fitted galaxy group is shown with a blue rectangle. The smooth noise level indicates that the contaminant emission is modeled properly in the analysis. Right: surface brightness profile of the same group. The observed surface brightness profile of the image is plotted in blue, the best-fit model of the image is plotted in red, the PSF profile over the measured background is plotted in green, the PSF deconvolved surface brightness profile of the galaxy group is plotted in orange, the measured background level is shown with a horizontal dashed red line, and three characteristic radii of the group (0.15r 500c, r2500c and r500c from the core to the outskirt respectively) are shown with dashed gray lines.
Current usage metrics show cumulative count of Article Views (full-text article views including HTML views, PDF and ePub downloads, according to the available data) and Abstracts Views on Vision4Press platform.
Data correspond to usage on the plateform after 2015. The current usage metrics is available 48-96 hours after online publication and is updated daily on week days.
Initial download of the metrics may take a while.