Fig. 2
Download original image
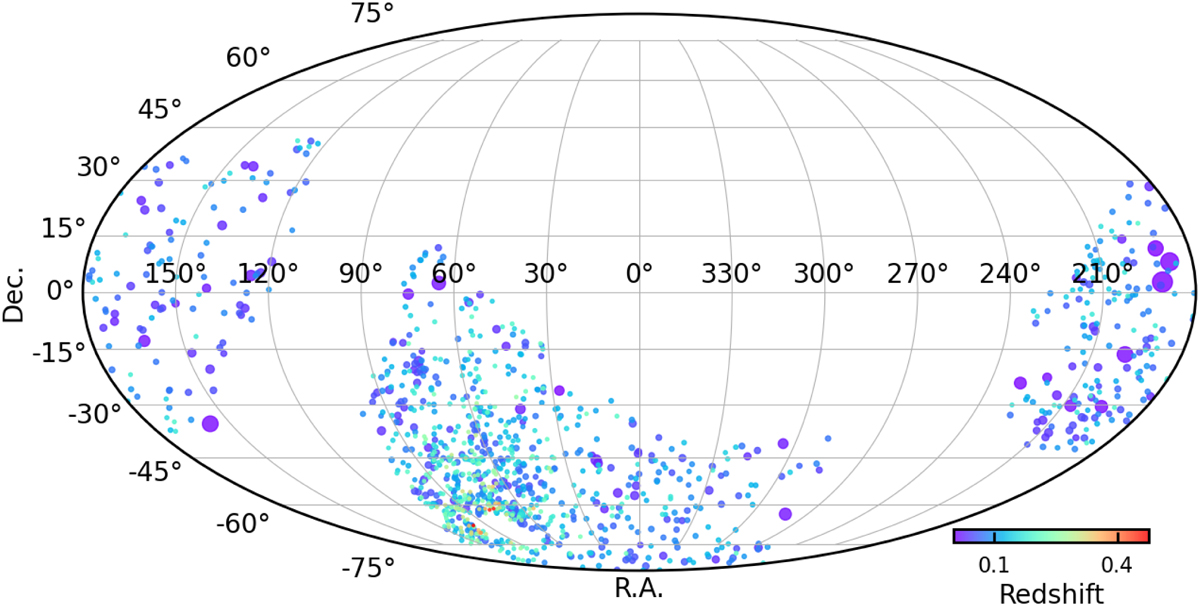
Projected locations of the 1178 galaxy groups in the primary catalog in the eROSITA and Legacy Survey DR9N and DR10 13,116 deg2 common footprints. The redshift confirmed by the follow-up algorithm eROMaPPer is color coded (Kluge et al. 2024), while the sizes of the detections are scaled with the angular sizes (r500c) of the groups (see Sect. 3.3 for the r500c estimation procedure). The inhomogeneity of the source density in this figure is due to the exposure variation across the eROSITA-DE X-ray sky (see Fig. 2 in Bulbul et al. 2024).
Current usage metrics show cumulative count of Article Views (full-text article views including HTML views, PDF and ePub downloads, according to the available data) and Abstracts Views on Vision4Press platform.
Data correspond to usage on the plateform after 2015. The current usage metrics is available 48-96 hours after online publication and is updated daily on week days.
Initial download of the metrics may take a while.