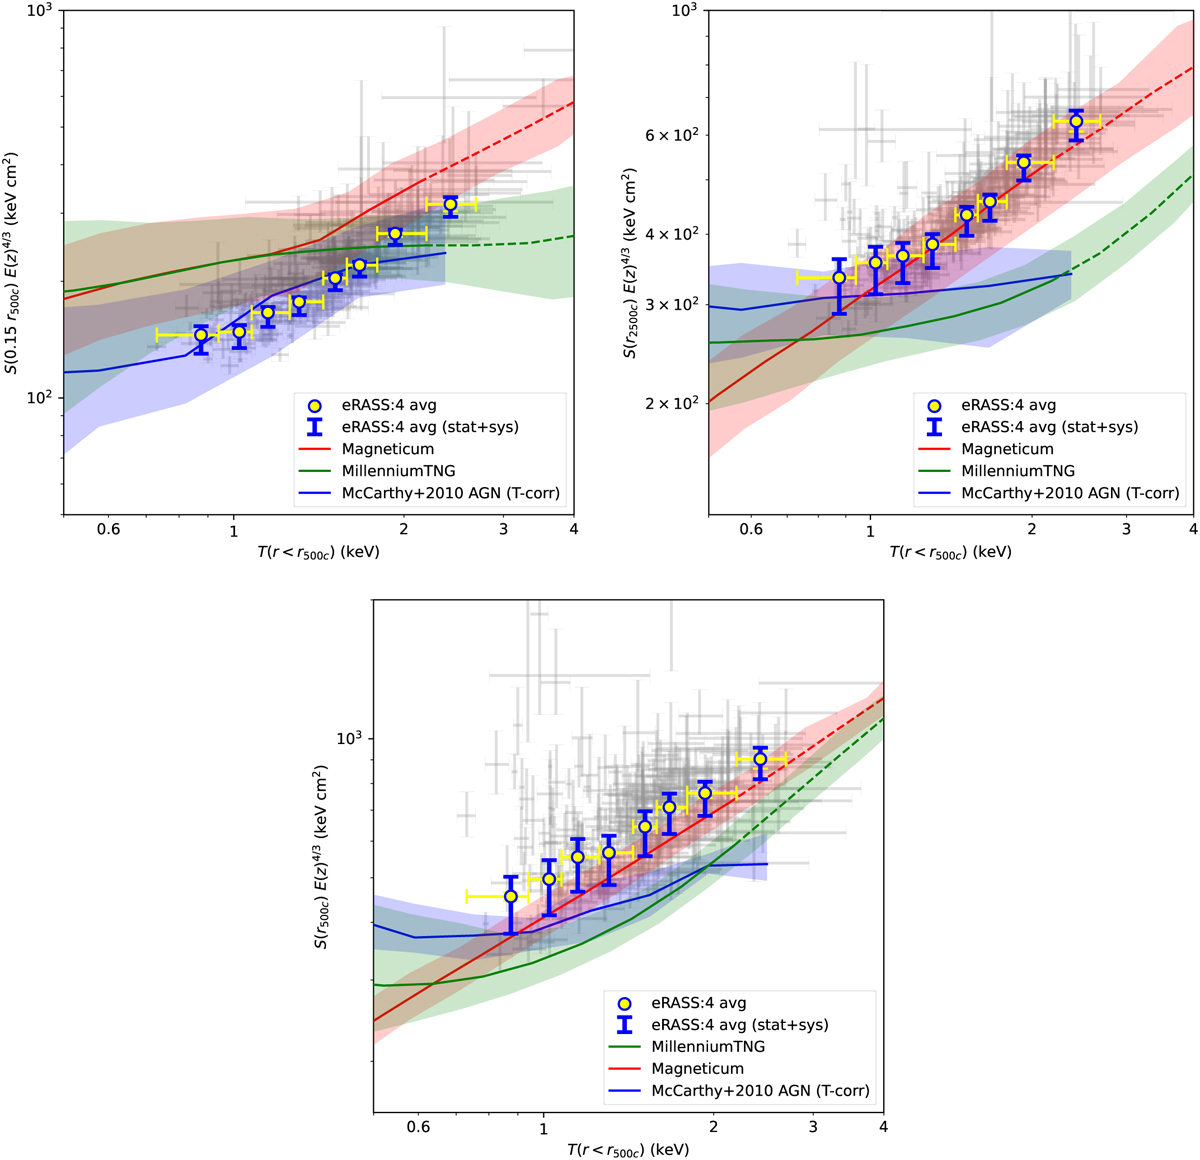
Fig. 16
Download original image
Comparison of the redshift evolution scaled average eROSITA entropy measurements (yellow circles) with the predictions of three simulations (Magneticum, MillenniumTNG, and OWL simulations) at 0.15r5ooc (top left), r25ooc (top right), and r5ooc (bottom) as a function of characteristic temperature, T(r < r500c). Gray crosses represent the average entropy measurements of the binned groups, and the blue error bars represent the overall error budget of the average measurements resulting from the statistical and systematic uncertainties (see Sect. 4 for the details of the accounted systematics). The solid lines represent the predictions of simulations at the group regime (5 × 10¹² < M500c < 1014 M⊙), the dashed lines represent the predictions at the low-mass cluster regime (1014 < M50oc < 3 × 10¹⁴ M⊙) and the shaded regions represent the scatter of the measurements.
Current usage metrics show cumulative count of Article Views (full-text article views including HTML views, PDF and ePub downloads, according to the available data) and Abstracts Views on Vision4Press platform.
Data correspond to usage on the plateform after 2015. The current usage metrics is available 48-96 hours after online publication and is updated daily on week days.
Initial download of the metrics may take a while.