Fig. 14
Download original image
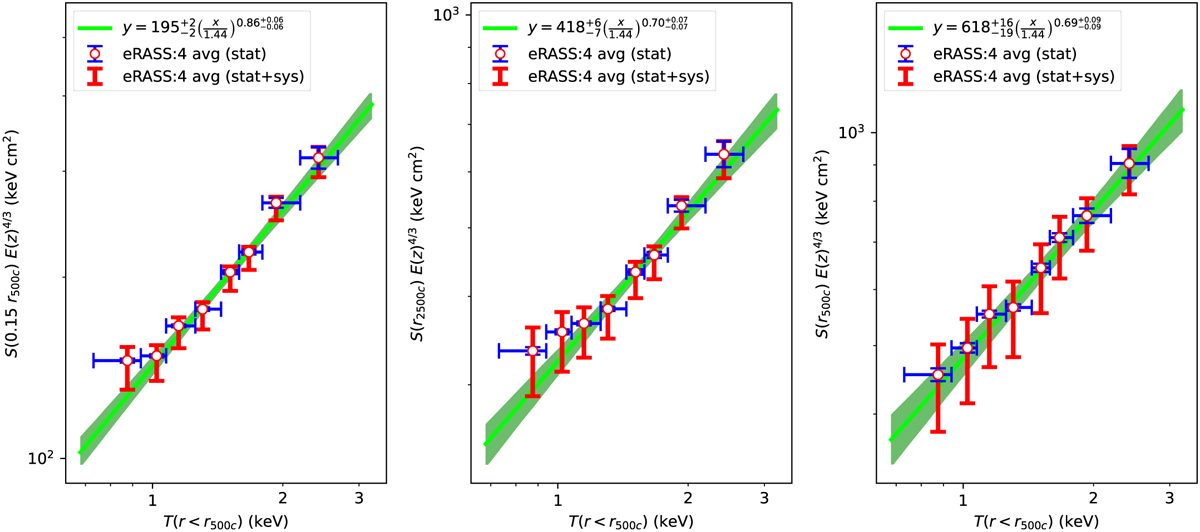
S (r) – T relations at 0.15r500c, r2500c and r500c. The white circles represent redshift evolution scaled average entropy measurements, blue error bars represent statistical uncertainties of the averages, and the red error bars represent the overall error budget of the average measurements resulting from the statistical and systematic uncertainties (see Sect. 4 for the details of the accounted systematics). The best-fit power-law models to the data points are plotted as light green lines, and the uncertainties of the best-fit lines are shown with dark green shaded regions.
Current usage metrics show cumulative count of Article Views (full-text article views including HTML views, PDF and ePub downloads, according to the available data) and Abstracts Views on Vision4Press platform.
Data correspond to usage on the plateform after 2015. The current usage metrics is available 48-96 hours after online publication and is updated daily on week days.
Initial download of the metrics may take a while.