Fig. 13
Download original image
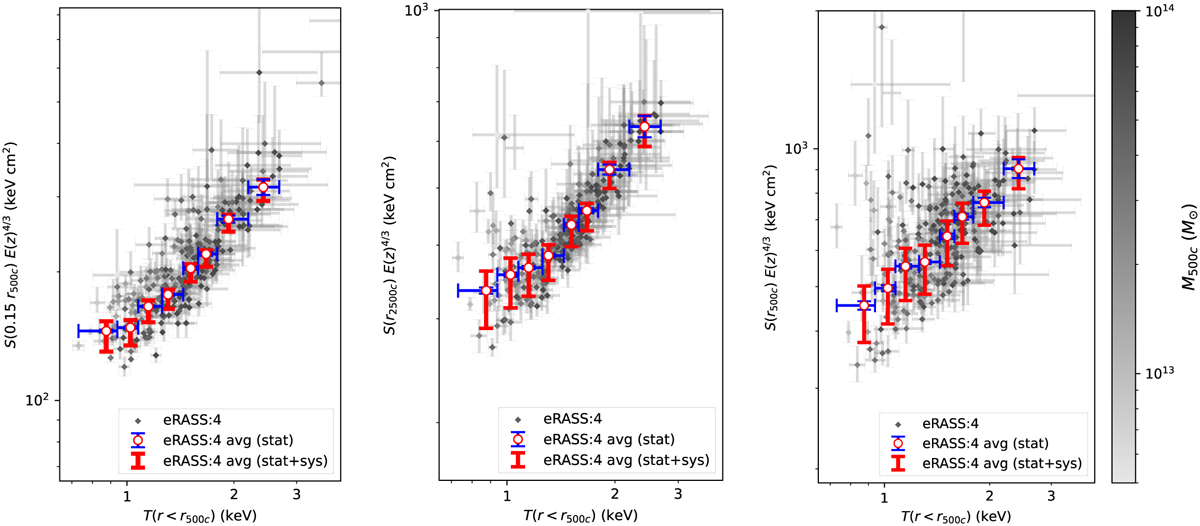
Redshift evolution scaled average entropy measurements of binned groups (gray diamonds) at three radii (0.15r500c, r2500c, r500c) as a function of characteristic temperature, T(r < r500c). The colors of the gray data points represent the average masses (M500c) of the groups within the corresponding Voronoi bin. Error-weighted averages of the data points are plotted as white circles, statistical uncertainties of the averages are shown with blue error bars, and the overall error budget of the average measurements resulting from the statistical and systematic uncertainties are shown with red error bars (see Sect. 4 for the details of the accounted systematics).
Current usage metrics show cumulative count of Article Views (full-text article views including HTML views, PDF and ePub downloads, according to the available data) and Abstracts Views on Vision4Press platform.
Data correspond to usage on the plateform after 2015. The current usage metrics is available 48-96 hours after online publication and is updated daily on week days.
Initial download of the metrics may take a while.