Fig. 10
Download original image
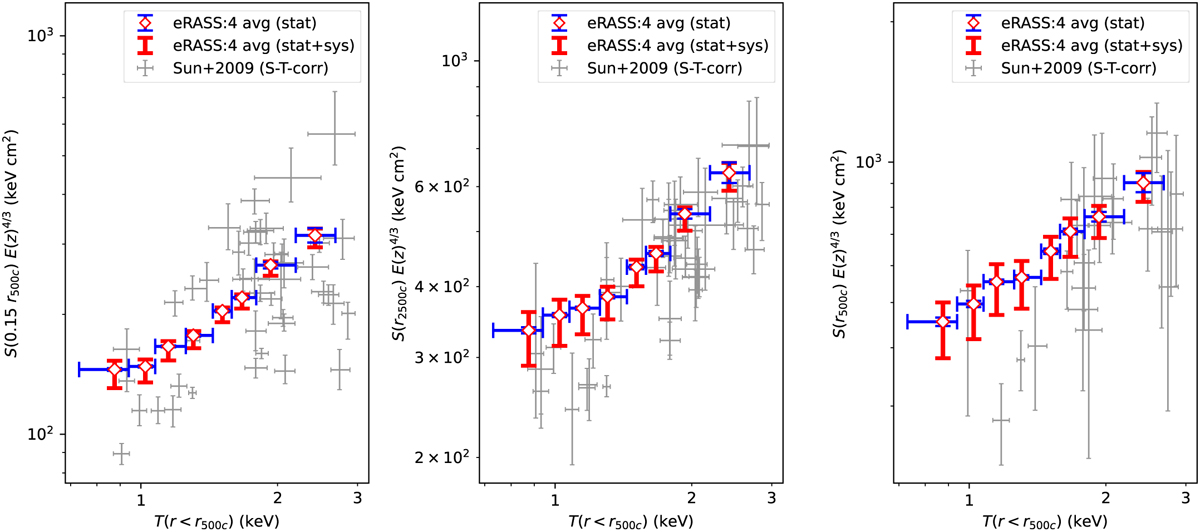
Comparison between the redshift evolution scaled average eROSITA entropy measurements (white diamonds) with the Chandra measurements of 43 galaxy groups (black error bars) presented in S09 at three radii (0.15r500c, r2500c, r500c) as a function of characteristic temperature, T(r < r500c). Blue error bars represent the statistical uncertainties of the average measurements, and the red error bars represent the overall error budget resulting from the statistical and systematic uncertainties (see Sect. 4 for the details of the accounted systematics). For consistency, coreexcised temperatures presented in S09 are converted to core-included temperatures, and the entropy measurements presented in S09 are normalized such that the new data points are measured at the same angular radii with eROSITA flux calibration (see Sect. 5 for the details of these corrections).
Current usage metrics show cumulative count of Article Views (full-text article views including HTML views, PDF and ePub downloads, according to the available data) and Abstracts Views on Vision4Press platform.
Data correspond to usage on the plateform after 2015. The current usage metrics is available 48-96 hours after online publication and is updated daily on week days.
Initial download of the metrics may take a while.