Fig. 8.
Download original image
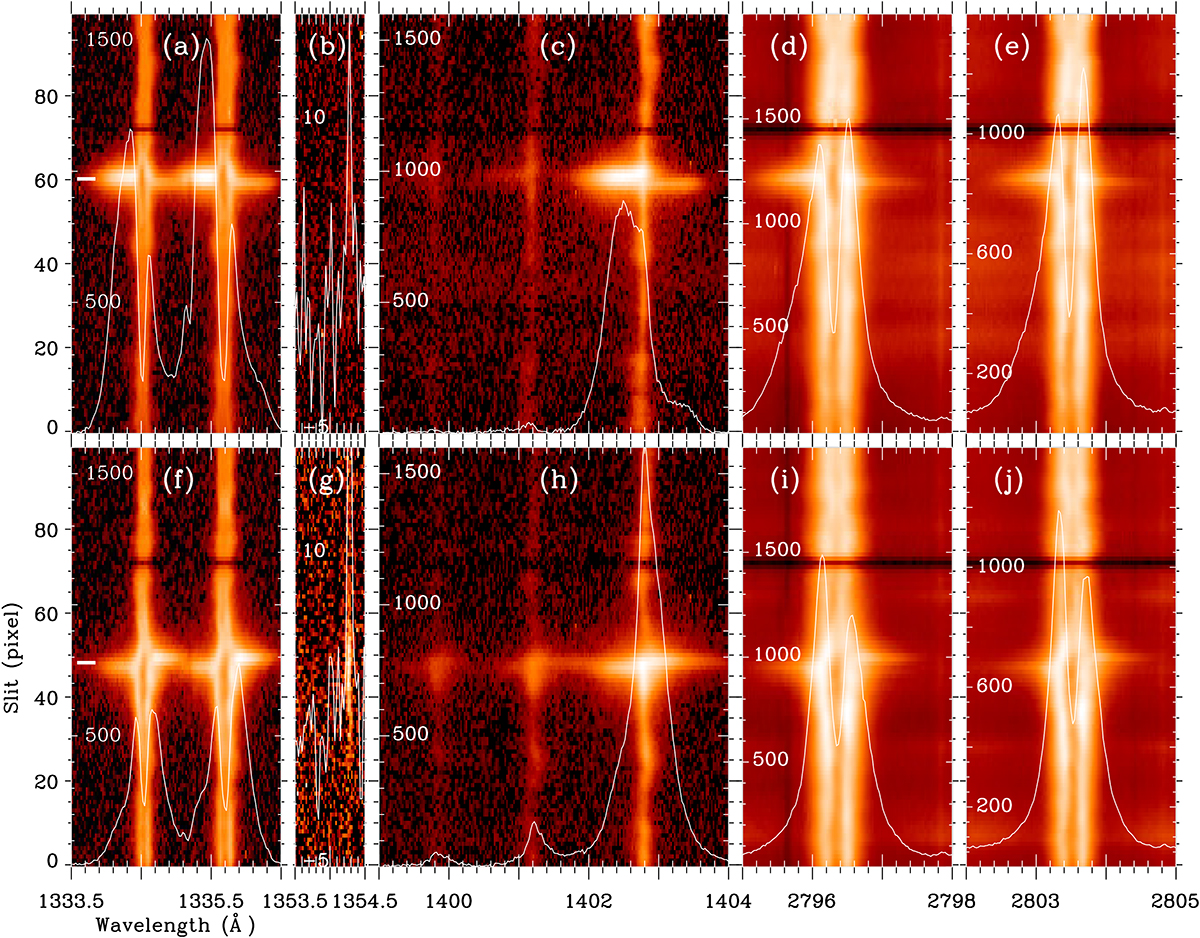
Performances of the spectrum. The spectral data in the five main windows of the IRIS at 02:35:00 UT (a–e) and 02:35:56 UT (f–j). The former was obtained at the position of raster 7, and the latter was obtained at the position of raster 5. The lines on which we focus in each panel are C II 1334.53/1335.71 Å (a, f), Fe XXI 1354.08 Å (b, g), Si IV 1402.77 Å (c, h), and Mg II k&h 2796.35/2803.52 Å (d&e, i&j). The white curve in each panel shows the intensity profile obtained at the site denoted by the short white bar in panels a and f.
Current usage metrics show cumulative count of Article Views (full-text article views including HTML views, PDF and ePub downloads, according to the available data) and Abstracts Views on Vision4Press platform.
Data correspond to usage on the plateform after 2015. The current usage metrics is available 48-96 hours after online publication and is updated daily on week days.
Initial download of the metrics may take a while.