Fig. 5.
Download original image
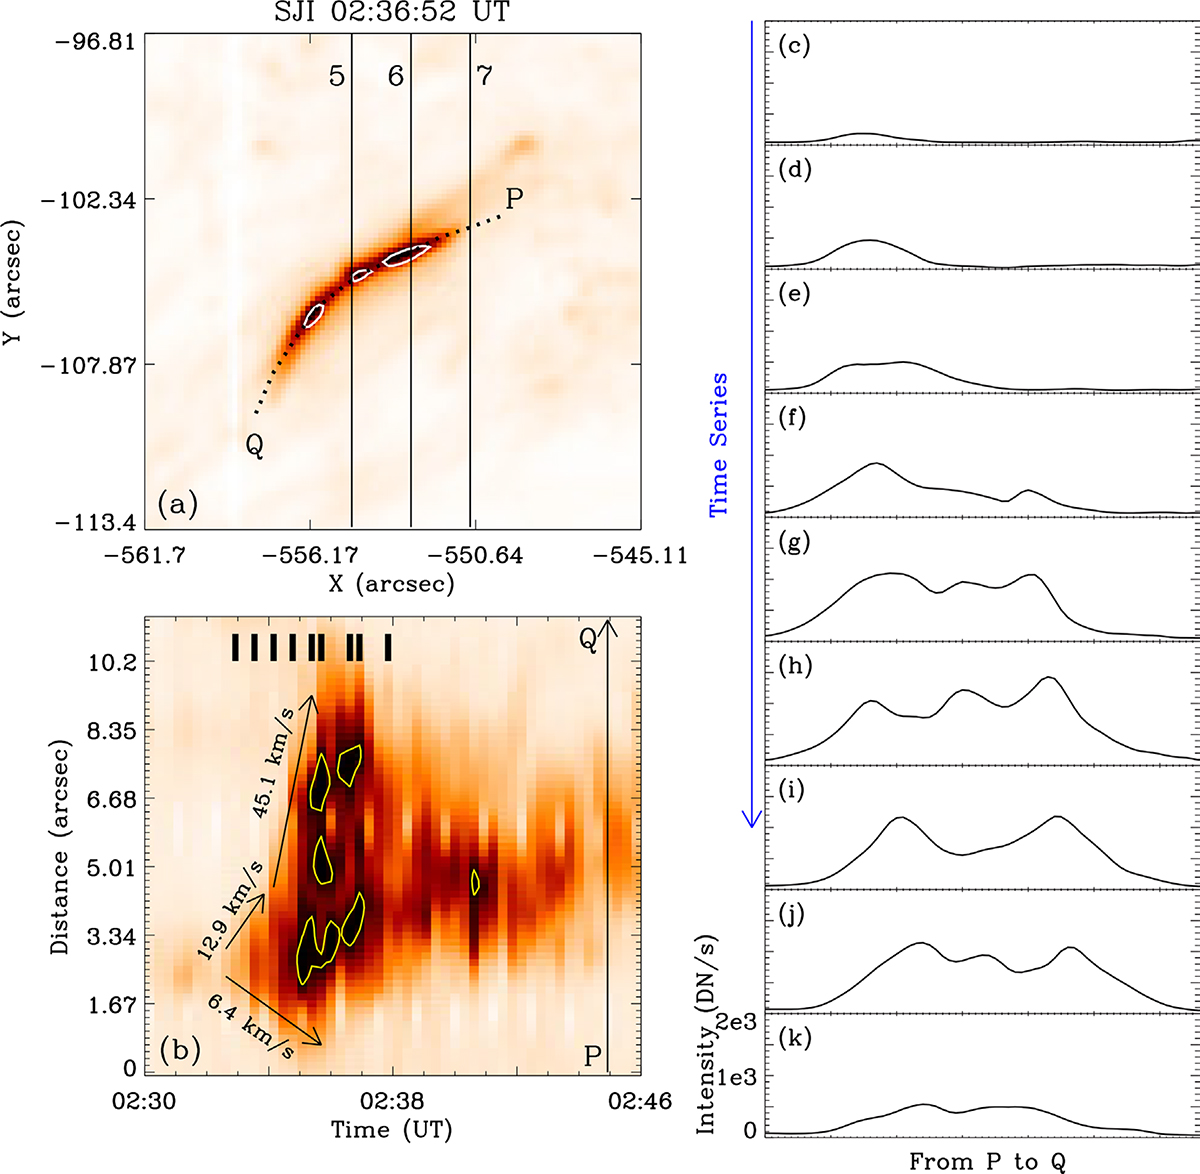
Performances of the LTB in IRIS SJI images. (a) SJI 1400 image overlaid with contours to denote the brightness kernels. The raster numbers 5, 6, and 7 are plotted. (b) Space-time brightness map obtained along the dotted line PQ in panel a. The intensity is on an inverse scale. (c)–(k) Intensity distribution in the instance marked by the short solid line in panel b. The black lines in panel a denote the position of the IRIS slits.
Current usage metrics show cumulative count of Article Views (full-text article views including HTML views, PDF and ePub downloads, according to the available data) and Abstracts Views on Vision4Press platform.
Data correspond to usage on the plateform after 2015. The current usage metrics is available 48-96 hours after online publication and is updated daily on week days.
Initial download of the metrics may take a while.