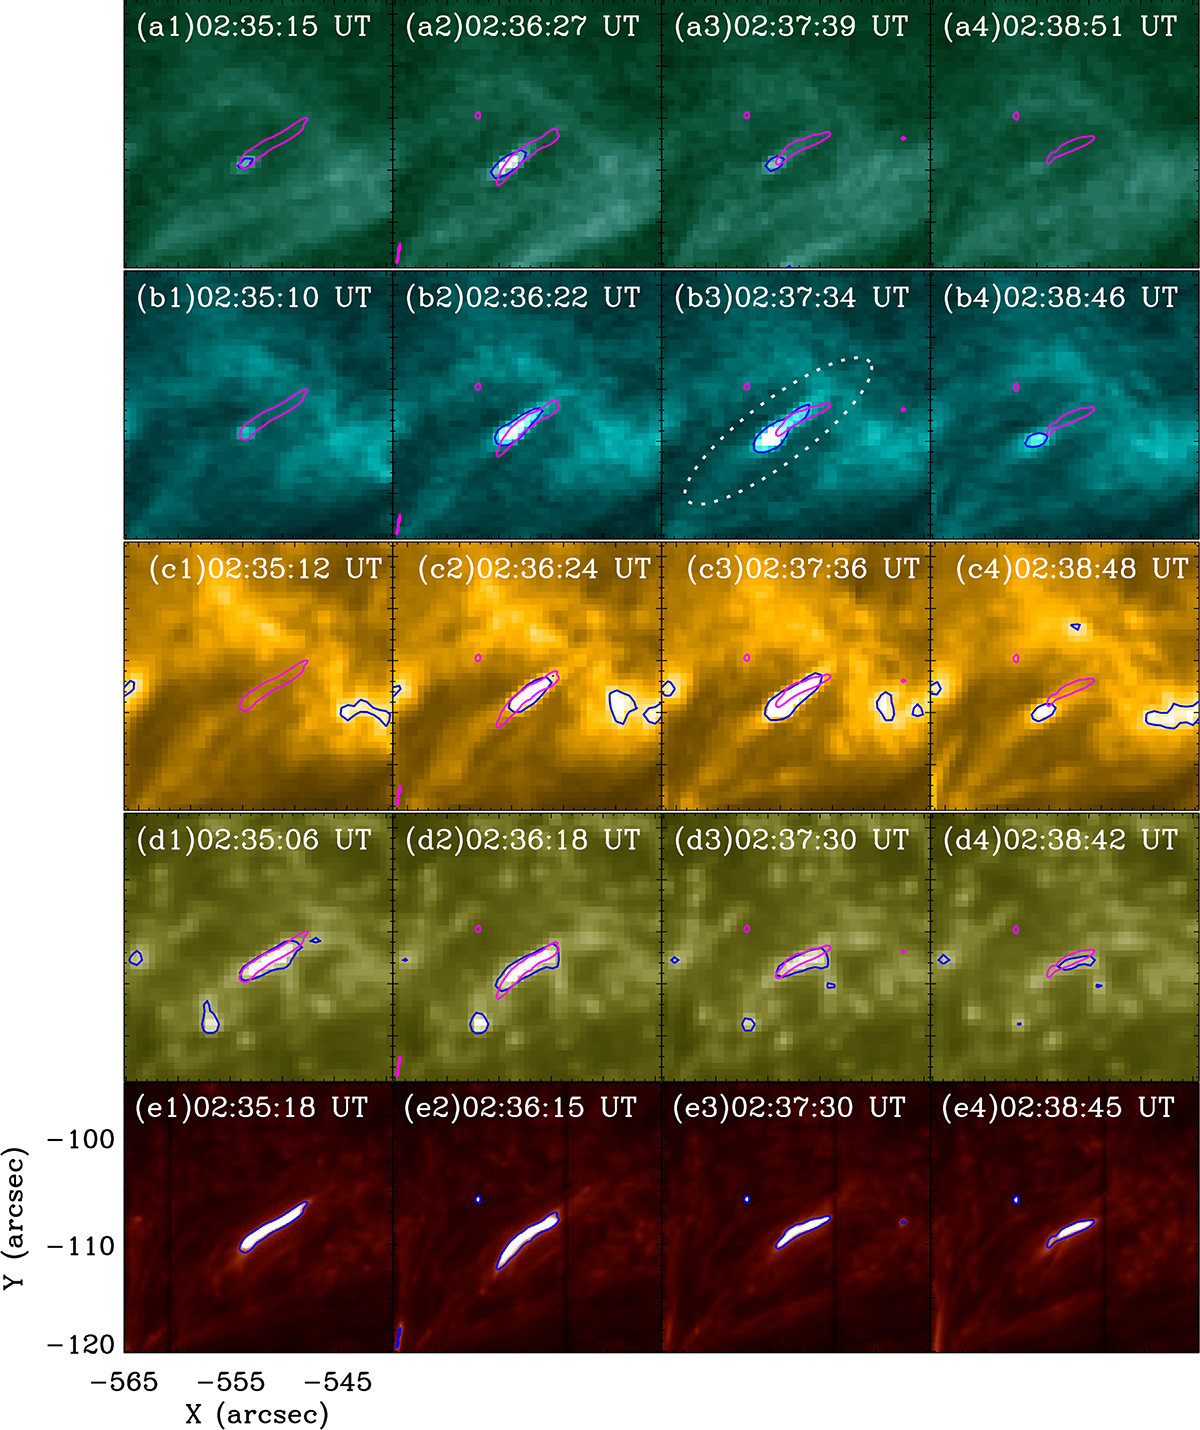
Fig. 2.
Download original image
Performances of the LTB in imaging observations. Manifestation of the LTB at different instants in each observed band, (a) AIA 94 Å band, (b) AIA 131 Å band, (c) AIA 171 Å band, (d) AIA 1600 Å band, and (e) IRIS/SJI 1400 Å band. The ellipse in panel b3 denotes the area based on which we calculated the emission light curves (Fig. 3) and the evolution of the maximum temperature and maximum emission measure (Fig. 7). The blue curves in panels a–e show the contours of the intensity at levels of 22 DN, 80 DN, 800 DN, 200 DN, and 280 DN. The pink curves in different AIA bands correspond to the contours of the SJI 1400 Å band.
Current usage metrics show cumulative count of Article Views (full-text article views including HTML views, PDF and ePub downloads, according to the available data) and Abstracts Views on Vision4Press platform.
Data correspond to usage on the plateform after 2015. The current usage metrics is available 48-96 hours after online publication and is updated daily on week days.
Initial download of the metrics may take a while.