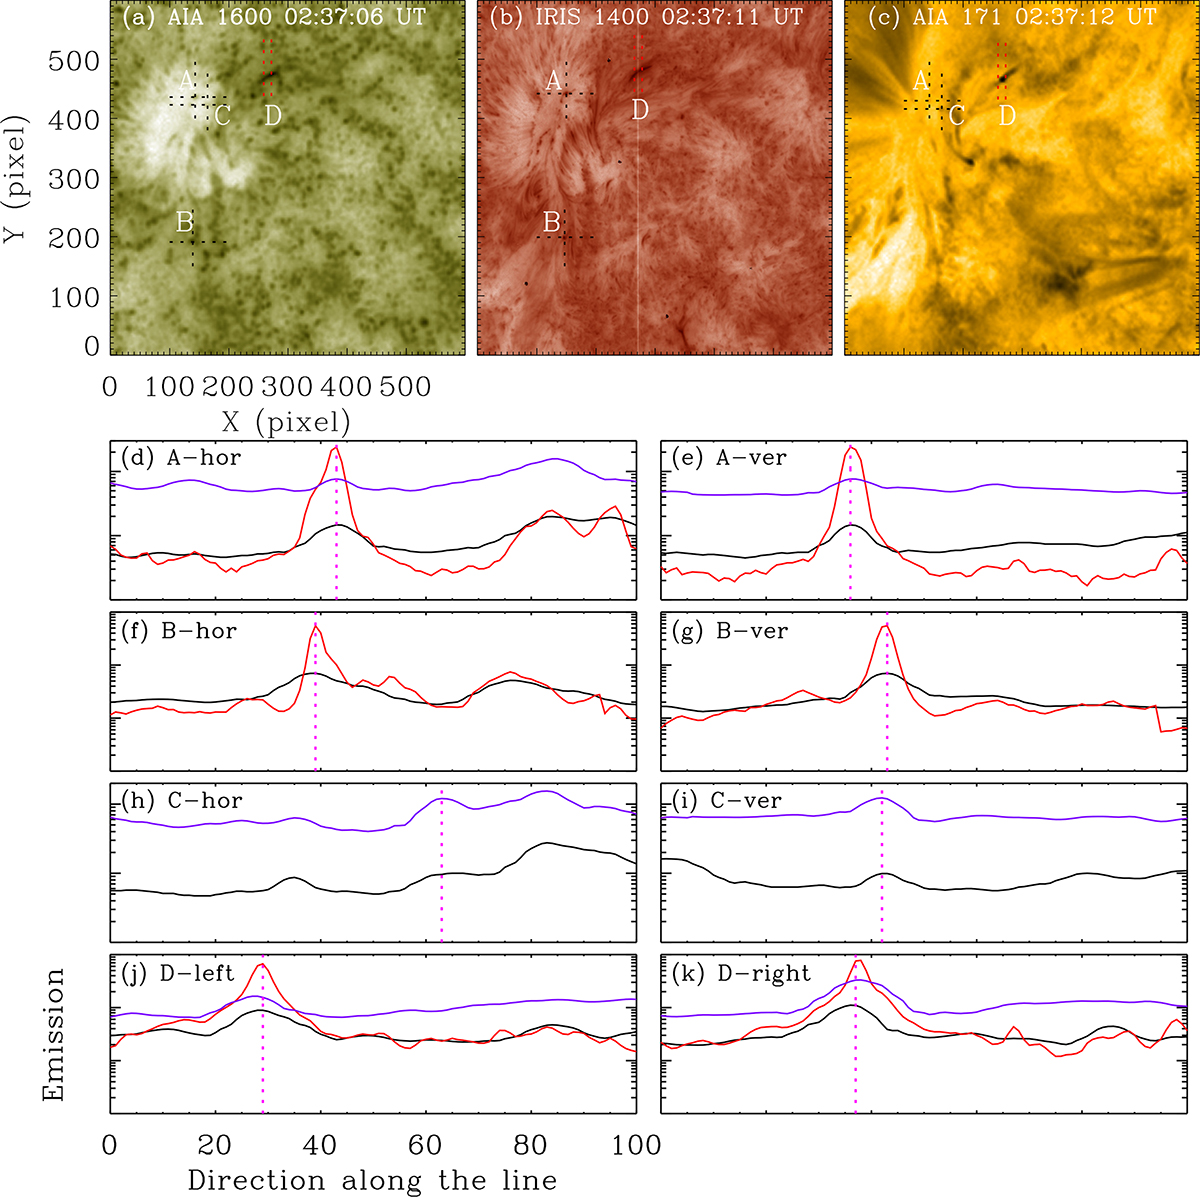
Fig. A.1.
Download original image
Spatial alignment between AIA 1600 Å, IRIS 1400 Å, and AIA 171 Å images. (a)-(c) The AIA and IRIS images at nearest times. The intensity in panels (a)-(c) are on an inverse scale. The horizontal and vertical lines at sampling points A, B, C, and D were used to determine the offset between observational bands. (d)-(k) The emission along the lines in panels (a)-(c). The black lines, red lines, and purple lines correspond to the emission of the AIA 1600 Å, the IRIS 1400 Å, and AIA 171 Å, respectively. The vertical pink lines denote the position of the sampling points. Abbreviation ’A-hor’ represents the horizontal line at point A, and the same applies to the others. Since we were only concerned with the changes in emission here, the vertical axis was not labelled with specific scales.
Current usage metrics show cumulative count of Article Views (full-text article views including HTML views, PDF and ePub downloads, according to the available data) and Abstracts Views on Vision4Press platform.
Data correspond to usage on the plateform after 2015. The current usage metrics is available 48-96 hours after online publication and is updated daily on week days.
Initial download of the metrics may take a while.