Open Access
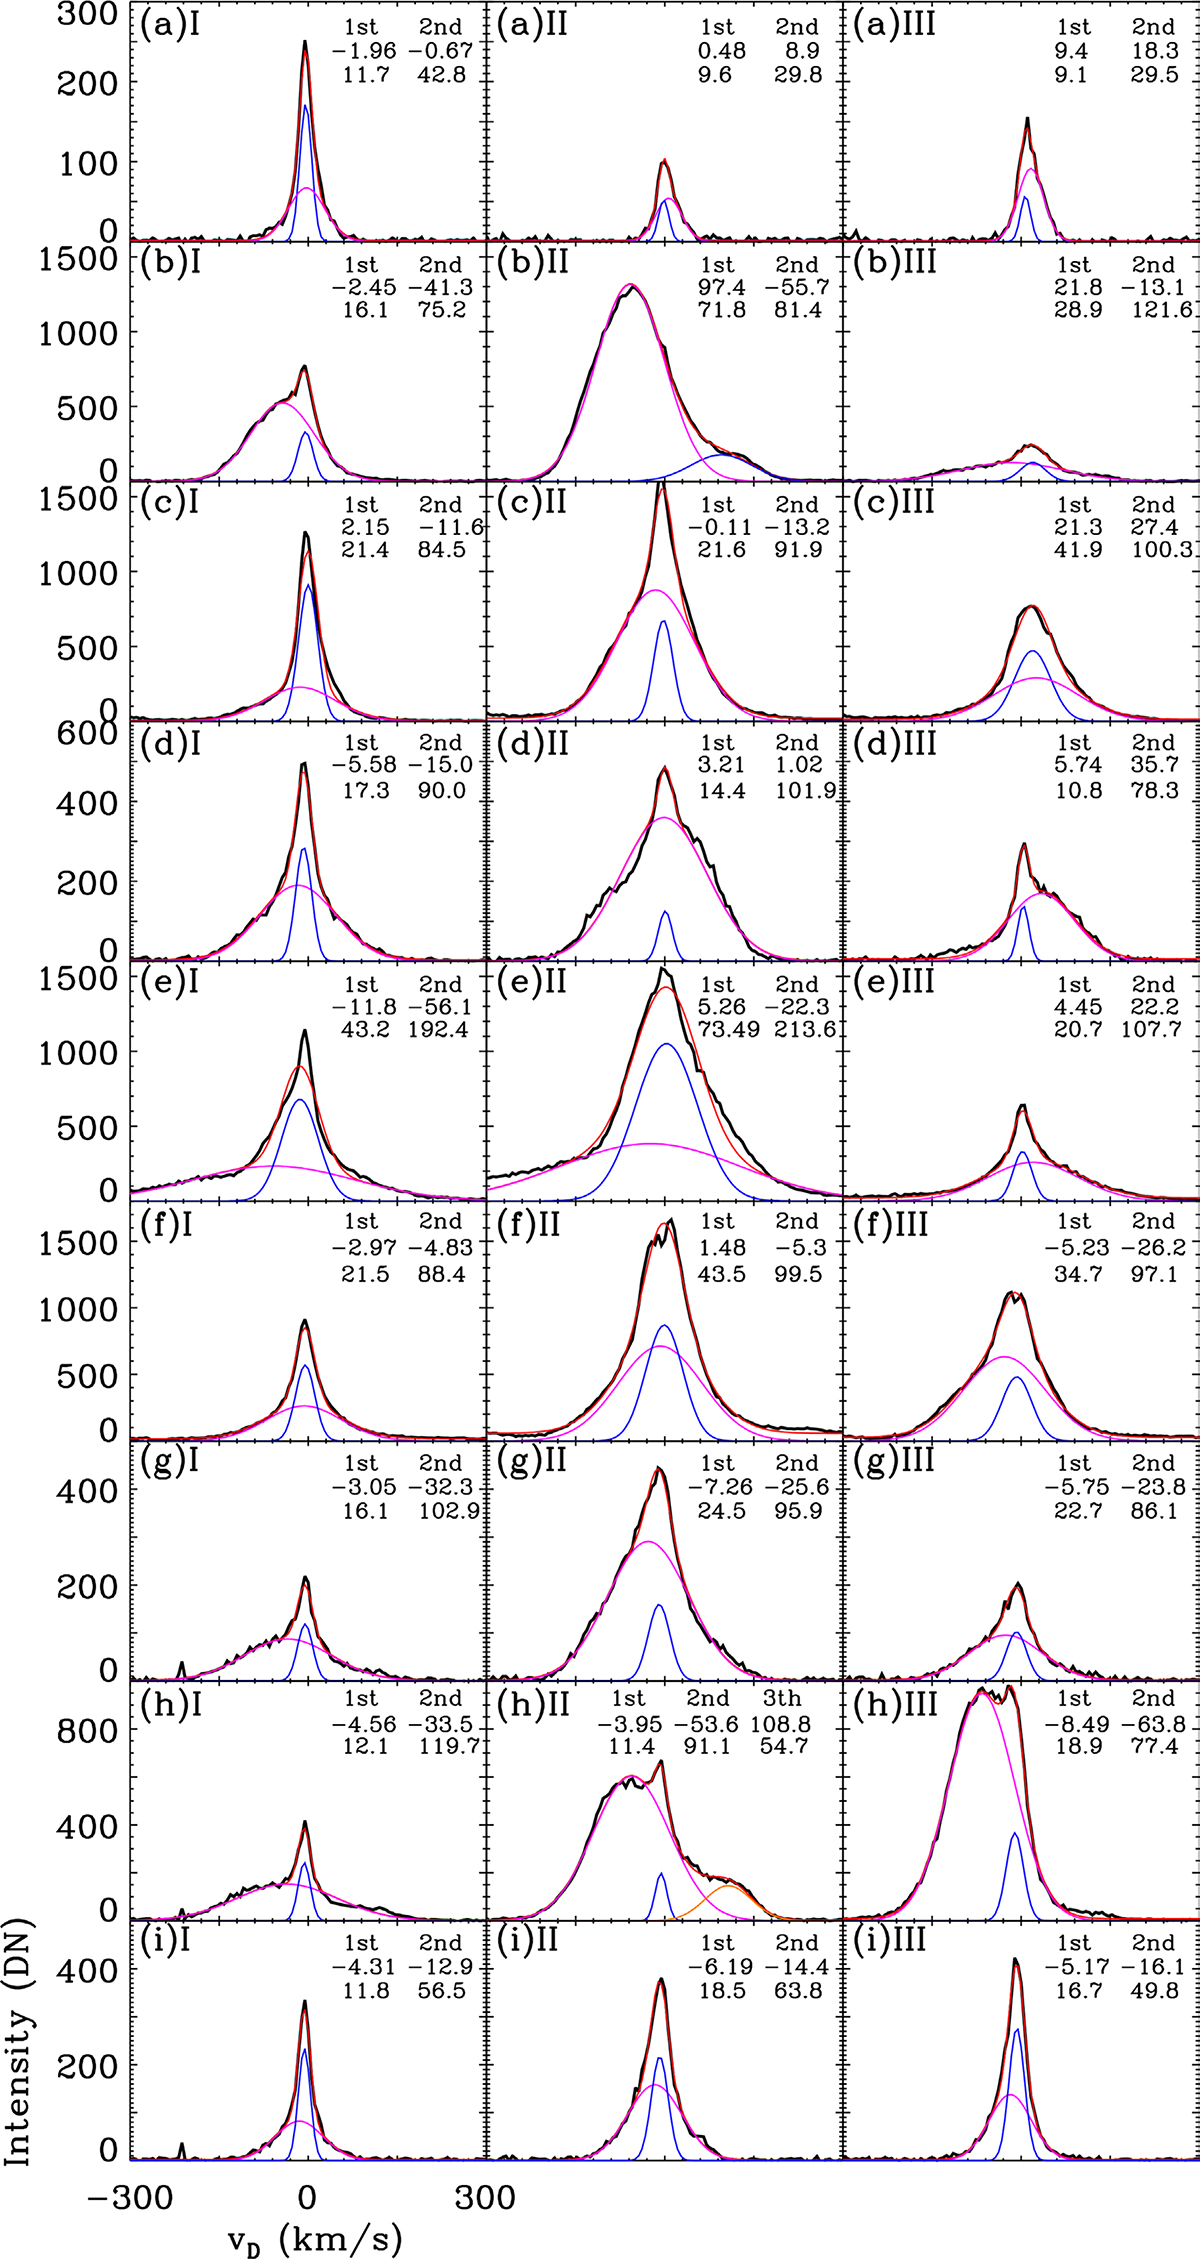
Fig. 10.
Download original image
Double-Gaussian fitting results of the Si IV line profiles, except for panel hII. The solid red, blue, purple, and yellow lines represent the overall profiles and the fitting components. The Doppler velocity (first row) and the derived nonthermal velocity (second row) of each component are presented in the panels.
Current usage metrics show cumulative count of Article Views (full-text article views including HTML views, PDF and ePub downloads, according to the available data) and Abstracts Views on Vision4Press platform.
Data correspond to usage on the plateform after 2015. The current usage metrics is available 48-96 hours after online publication and is updated daily on week days.
Initial download of the metrics may take a while.