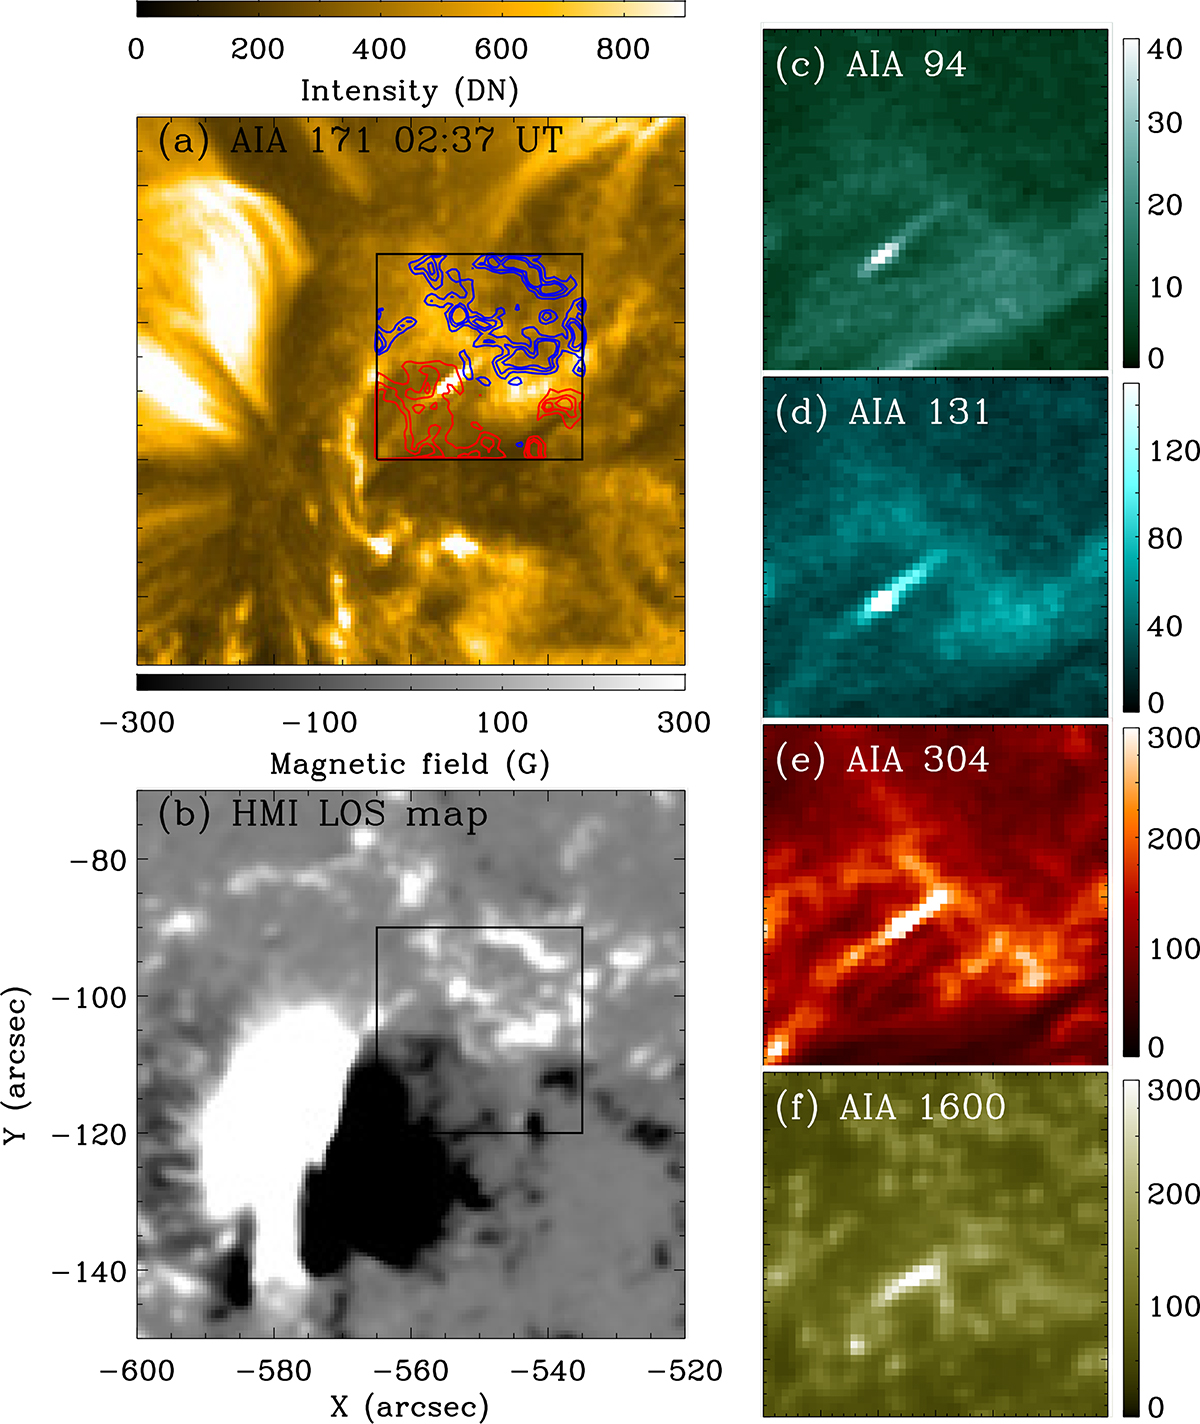
Fig. 1.
Download original image
Overview observations of the LTB. (a) Manifestation of the LTB at 02:37 UT in the AIA 171 image, overlaid with the distribution of the magnetic field in the region of interest. (b) LOS magnetic fields from HMI in the corresponding area. The white areas (blue contours) indicate the magnetic field with a positive polarity, while black areas (red contours) indicate the magnetic field with a negative polarity. (c)–(f) Enlarged AIA images at four different bands in the region marked by the black box in panel a. The red and blue curves in panel a denote contours of the magnetic field with strengths of ±100 G, ±200 G, and ±300 G.
Current usage metrics show cumulative count of Article Views (full-text article views including HTML views, PDF and ePub downloads, according to the available data) and Abstracts Views on Vision4Press platform.
Data correspond to usage on the plateform after 2015. The current usage metrics is available 48-96 hours after online publication and is updated daily on week days.
Initial download of the metrics may take a while.